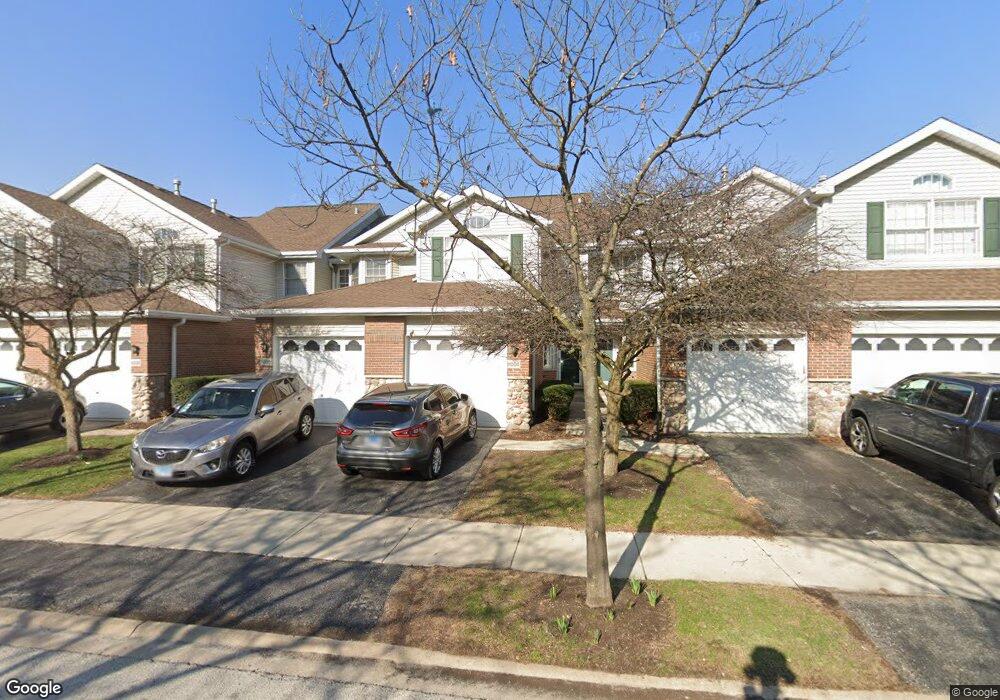
11004 Deblin Ln Oak Lawn, IL 60453
Estimated Value: $292,000 - $323,000
3
Beds
3
Baths
1,785
Sq Ft
$172/Sq Ft
Est. Value
About This Home
This home is located at 11004 Deblin Ln, Oak Lawn, IL 60453 and is currently estimated at $306,999, approximately $171 per square foot. 11004 Deblin Ln is a home located in Cook County with nearby schools including Stony Creek Elementary School, Prairie Jr High School, and Harold L. Richards High School.
Ownership History
Date
Name
Owned For
Owner Type
Purchase Details
Closed on
Dec 12, 2005
Sold by
Bokar Pedroza Leah
Bought by
Pedroza Fernando and Bokar Pedroza Leah
Current Estimated Value
Purchase Details
Closed on
Sep 28, 2005
Sold by
Bokar Leah and Bokar Pedroza Leah
Bought by
Bokar Pedroza Leah
Purchase Details
Closed on
Jul 15, 2003
Sold by
Velazquez Miguel A
Bought by
Bokar Leah
Home Financials for this Owner
Home Financials are based on the most recent Mortgage that was taken out on this home.
Original Mortgage
$187,064
Outstanding Balance
$79,830
Interest Rate
5.31%
Mortgage Type
FHA
Estimated Equity
$227,169
Purchase Details
Closed on
Sep 20, 1999
Sold by
First National Bank Of Blue Island
Bought by
Velazquez Miguel A
Home Financials for this Owner
Home Financials are based on the most recent Mortgage that was taken out on this home.
Original Mortgage
$151,350
Interest Rate
7.87%
Create a Home Valuation Report for This Property
The Home Valuation Report is an in-depth analysis detailing your home's value as well as a comparison with similar homes in the area
Home Values in the Area
Average Home Value in this Area
Purchase History
| Date | Buyer | Sale Price | Title Company |
|---|---|---|---|
| Pedroza Fernando | -- | None Available | |
| Bokar Pedroza Leah | -- | Stewart Title Of Illinois | |
| Bokar Leah | $196,000 | Multiple | |
| Velazquez Miguel A | $161,500 | Ticor Title |
Source: Public Records
Mortgage History
| Date | Status | Borrower | Loan Amount |
|---|---|---|---|
| Open | Bokar Leah | $187,064 | |
| Previous Owner | Velazquez Miguel A | $151,350 |
Source: Public Records
Tax History Compared to Growth
Tax History
| Year | Tax Paid | Tax Assessment Tax Assessment Total Assessment is a certain percentage of the fair market value that is determined by local assessors to be the total taxable value of land and additions on the property. | Land | Improvement |
|---|---|---|---|---|
| 2024 | $6,274 | $24,005 | $1,070 | $22,935 |
| 2023 | $5,302 | $24,005 | $1,070 | $22,935 |
| 2022 | $5,302 | $17,770 | $928 | $16,842 |
| 2021 | $5,084 | $17,768 | $927 | $16,841 |
| 2020 | $5,136 | $17,768 | $927 | $16,841 |
| 2019 | $6,153 | $20,544 | $856 | $19,688 |
| 2018 | $5,914 | $20,544 | $856 | $19,688 |
| 2017 | $6,021 | $20,544 | $856 | $19,688 |
| 2016 | $5,213 | $16,567 | $713 | $15,854 |
| 2015 | $5,159 | $16,567 | $713 | $15,854 |
| 2014 | $5,059 | $16,567 | $713 | $15,854 |
| 2013 | $6,259 | $18,743 | $713 | $18,030 |
Source: Public Records
Map
Nearby Homes
- 11000 Deblin Ln
- 5120 Deblin Ln
- 11001 Deblin Ln Unit 203
- 5111 Deblin Ln Unit 3B
- 10816 Leclaire Ave
- 11152 S Lawler Ave
- 10720 Laramie Ave
- 4917 W 109th St Unit 202
- 10724 Lawler Ave
- 10737 Long Ave
- 10652 Laramie Ave
- 10720 Lamon Ave
- 10624 Lawler Ave
- 5128 W 113th St
- 11010 Central Ave Unit 3A
- 11000 Central Ave Unit 2C
- 10930 Central Ave Unit 1B
- 10908 Keating Ave
- 10540 Lockwood Ave
- 5311 W Mint Julip Dr Unit 301
- 11006 Deblin Ln
- 11002 Deblin Ln
- 11002 Deblin Ln Unit 1100
- 11002 Deblin Ln Unit 44
- 11008 Deblin Ln
- 11010 Deblin Ln
- 10948 Deblin Ln
- 11005 Jodan Dr
- 11003 Jodan Dr
- 11007 Jodan Dr
- 11001 Jodan Dr
- 11009 Jodan Dr Unit 69
- 11012 Deblin Ln
- 11011 Jodan Dr
- 10946 Deblin Ln
- 11014 Deblin Ln
- 10949 Jodan Dr
- 10944 Deblin Ln
- 11013 Jodan Dr
- 11016 Deblin Ln