


11005 N Waterton Dunlap, IL 61525
North Peoria Neighborhood
4
Beds
2.5
Baths
2,300
Sq Ft
7,623
Sq Ft Lot
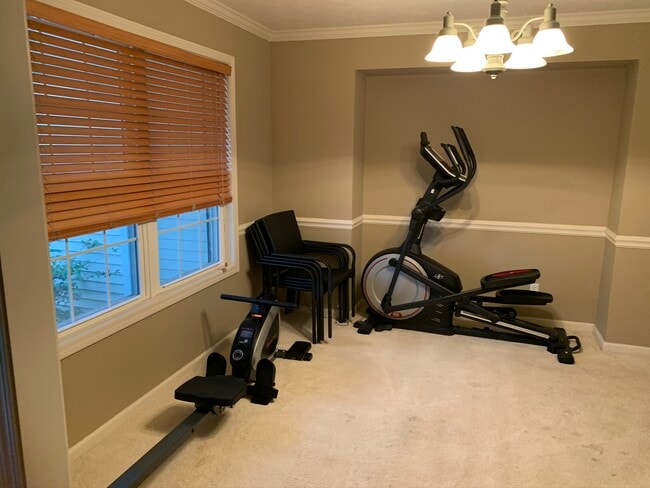
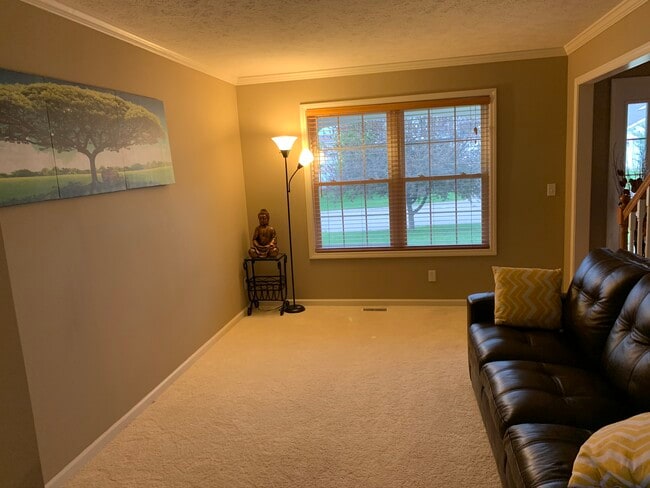
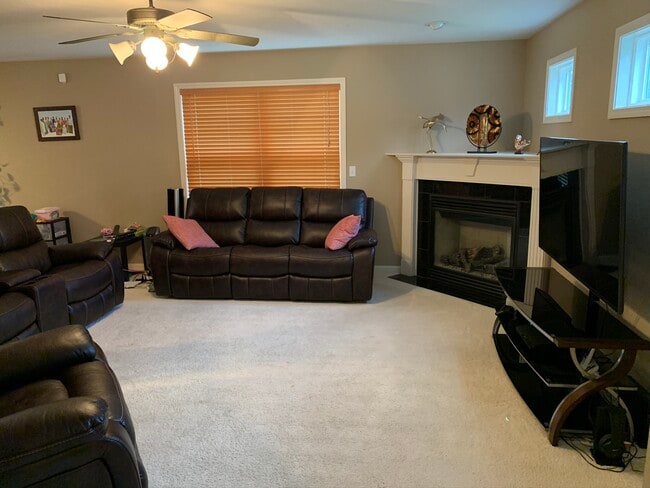
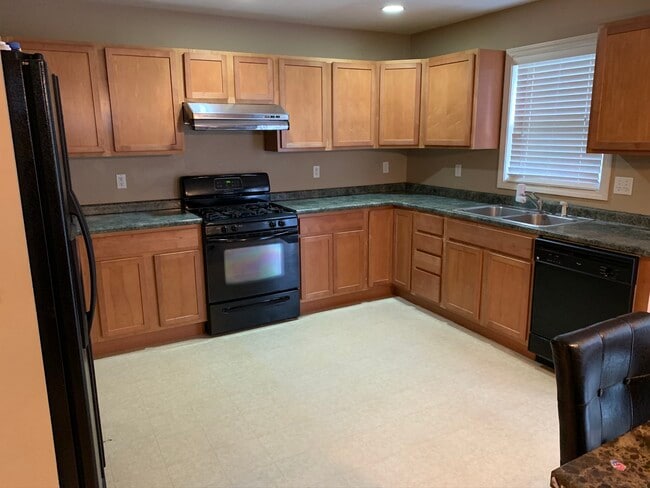
About This Home
This house is in an excellent school district and in a good condition. It is also in a park and has a very good neighborhood.
Listing Provided By

Map
Nearby Homes
- 11103 N Northfield Ln
- 1315 W Wexford Place
- 11217 N Oakwood Dr Unit 33
- 1203 W Wexford Place
- 1205 W Poplar Woods Ct
- 1634 W Alta Rd
- 2407 W Miners Dr
- 2010 W Alta Rd
- 0 W Alta Rd
- 2609 W Arden Way
- 1318 W Featherwood Dr
- 10019 N Spring Ln
- 10422 N North Forest Trail
- 2619 W Sunset Ct
- 511 W Mossville Rd
- 2218 W Augusta Dr
- 2233 W Augusta Dr
- 2247 W Augusta Dr
- 2203 W Augusta Dr
- 11310 N Copper Creek Point
- 1611 W Geneva Rd
- 2119 W Miners Dr
- 2315 W Paddington Ct
- 1700 W Coneflower Dr
- 10013 Brompton Ct
- 12300 N Brentfield Dr
- 9019 N Locust Ln
- 1008 W Singing Woods Rd
- 1526 W Candletree Dr
- 7615 Walnut Bend Dr
- 2215 W Willow Knolls Dr
- 935 W Loire Ct
- 7400 N Villa Lake Dr
- 2221-2227 Willow Knolls Dr W
- 2311 W Willow Knolls Dr
- 2630 W Willowlake Dr
- 7150 N Terra Vista Dr
- 2632 W Willowlake Dr Unit 614
- 3015-3031 W Willow Knolls Dr
- 1508 W Tiffany Dr