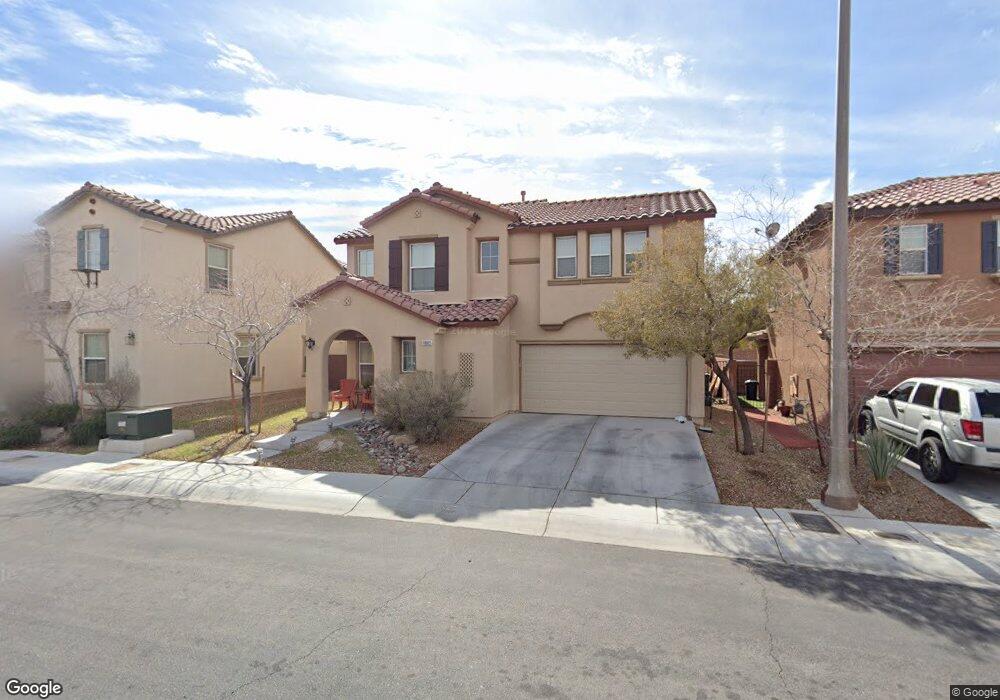
11005 Sundad St Unit 4C Las Vegas, NV 89179
Mountains Edge NeighborhoodEstimated Value: $392,000 - $418,000
3
Beds
3
Baths
1,540
Sq Ft
$263/Sq Ft
Est. Value
About This Home
This home is located at 11005 Sundad St Unit 4C, Las Vegas, NV 89179 and is currently estimated at $404,982, approximately $262 per square foot. 11005 Sundad St Unit 4C is a home located in Clark County with nearby schools including Desert Oasis High School and Doral Academy Cactus.
Ownership History
Date
Name
Owned For
Owner Type
Purchase Details
Closed on
Jul 6, 2011
Sold by
Secretary Of Housing & Urban Development
Bought by
Saenz Phyllis
Current Estimated Value
Home Financials for this Owner
Home Financials are based on the most recent Mortgage that was taken out on this home.
Original Mortgage
$107,739
Outstanding Balance
$77,487
Interest Rate
5.5%
Mortgage Type
FHA
Estimated Equity
$327,495
Purchase Details
Closed on
Jul 23, 2010
Sold by
Adamski Brandy L and Suarez Juan J
Bought by
Bac Home Loans Servicing Lp and Countrywide Home Loans Servicing Lp
Purchase Details
Closed on
Jun 17, 2008
Sold by
Kb Home Nevada Inc
Bought by
Adamski Brandy L and Suarez Juan J
Home Financials for this Owner
Home Financials are based on the most recent Mortgage that was taken out on this home.
Original Mortgage
$193,377
Interest Rate
6.04%
Mortgage Type
FHA
Create a Home Valuation Report for This Property
The Home Valuation Report is an in-depth analysis detailing your home's value as well as a comparison with similar homes in the area
Home Values in the Area
Average Home Value in this Area
Purchase History
| Date | Buyer | Sale Price | Title Company |
|---|---|---|---|
| Saenz Phyllis | $110,000 | Nevada Title Las Vegas | |
| Bac Home Loans Servicing Lp | $210,863 | First American National Def | |
| The Secretary Of Housing & Urban Develop | $210,863 | First American National Def | |
| Adamski Brandy L | $196,110 | First American Title Howard |
Source: Public Records
Mortgage History
| Date | Status | Borrower | Loan Amount |
|---|---|---|---|
| Open | Saenz Phyllis | $107,739 | |
| Previous Owner | Adamski Brandy L | $193,377 |
Source: Public Records
Tax History Compared to Growth
Tax History
| Year | Tax Paid | Tax Assessment Tax Assessment Total Assessment is a certain percentage of the fair market value that is determined by local assessors to be the total taxable value of land and additions on the property. | Land | Improvement |
|---|---|---|---|---|
| 2025 | $1,887 | $101,421 | $35,000 | $66,421 |
| 2024 | $1,748 | $101,421 | $35,000 | $66,421 |
| 2023 | $1,748 | $94,031 | $31,500 | $62,531 |
| 2022 | $1,619 | $83,220 | $26,250 | $56,970 |
| 2021 | $1,499 | $78,596 | $24,500 | $54,096 |
| 2020 | $1,389 | $76,983 | $23,450 | $53,533 |
| 2019 | $1,302 | $72,815 | $20,300 | $52,515 |
| 2018 | $1,242 | $66,331 | $16,100 | $50,231 |
| 2017 | $1,930 | $65,812 | $15,050 | $50,762 |
| 2016 | $1,164 | $57,686 | $11,200 | $46,486 |
| 2015 | $1,161 | $52,007 | $8,750 | $43,257 |
| 2014 | $1,127 | $37,275 | $5,600 | $31,675 |
Source: Public Records
Map
Nearby Homes
- 7286 Caballo Range Ave
- 7125 Neches Ave
- 0 W Erie Ave
- 10925 Prudhoe Bay St
- 7414 Morisset Ave
- 7397 Cobbhan Dr
- 7104 Flathead River Ave
- 7182 Hood River Ave
- 7440 Earnshaw Ave
- 10993 Dunoon St
- 11083 Camden Bay St
- 7063 Bering Strait Ave
- 7171 Sunny Countryside Ave
- 7115 Hickory Post Ave
- 7012 Grand Junction Ave
- 6994 Geronimo Springs Ave
- 7134 Mountain Den Ave
- 10715 Morning Frost St
- 10730 Lightning Sky St
- 11068 Hunting Hawk Rd
- 11011 Sundad St
- 11011 Sundad St Unit non
- 11011 Sundad St Unit none
- 10999 Sundad St
- 11017 Sundad St
- 10993 Sundad St
- 7249 Huckaby Ave
- 7234 Las Colinas Ave
- 11022 Cherokee Landing St
- 11016 Cherokee Landing St
- 11023 Sundad St
- 11010 Cherokee Landing St
- 10987 Sundad St
- 11028 Cherokee Landing St
- 7239 Huckaby Ave
- 11004 Cherokee Landing St
- 7266 Huckaby Ave
- 11034 Cherokee Landing St
- 7256 Huckaby Ave
- 7224 Las Colinas Ave