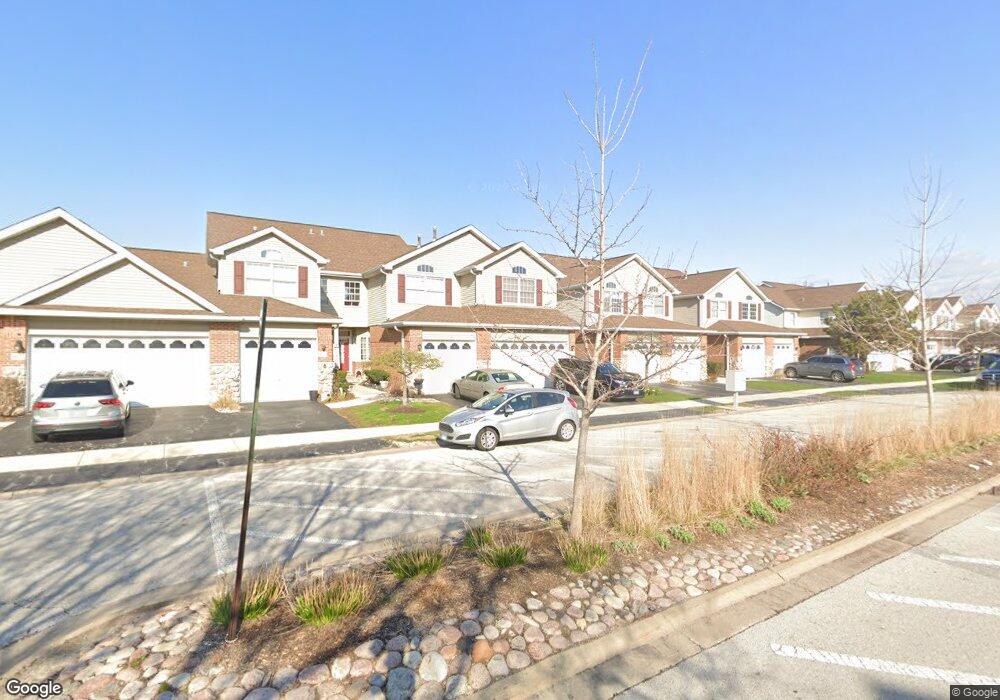
11006 Jodan Dr Oak Lawn, IL 60453
Estimated Value: $302,000 - $341,000
3
Beds
2
Baths
1,734
Sq Ft
$184/Sq Ft
Est. Value
About This Home
This home is located at 11006 Jodan Dr, Oak Lawn, IL 60453 and is currently estimated at $318,784, approximately $183 per square foot. 11006 Jodan Dr is a home located in Cook County with nearby schools including Stony Creek Elementary School, Prairie Jr High School, and Harold L. Richards High School.
Ownership History
Date
Name
Owned For
Owner Type
Purchase Details
Closed on
Sep 11, 2000
Sold by
Gurgone Sandra M
Bought by
Bislimi Isen and Bislimi Shenadie
Current Estimated Value
Home Financials for this Owner
Home Financials are based on the most recent Mortgage that was taken out on this home.
Original Mortgage
$175,000
Outstanding Balance
$63,555
Interest Rate
8.05%
Estimated Equity
$255,229
Purchase Details
Closed on
Apr 19, 2000
Sold by
Lasalle Bank National Assn
Bought by
Gurgone Sandra M and Sandra M Gurgone Trust
Purchase Details
Closed on
Jun 20, 1996
Sold by
First National Bank Of Blue Island
Bought by
American National Bk & Tr Co Of Chicago
Home Financials for this Owner
Home Financials are based on the most recent Mortgage that was taken out on this home.
Original Mortgage
$133,400
Interest Rate
5.2%
Create a Home Valuation Report for This Property
The Home Valuation Report is an in-depth analysis detailing your home's value as well as a comparison with similar homes in the area
Home Values in the Area
Average Home Value in this Area
Purchase History
| Date | Buyer | Sale Price | Title Company |
|---|---|---|---|
| Bislimi Isen | $185,000 | -- | |
| Gurgone Sandra M | -- | -- | |
| American National Bk & Tr Co Of Chicago | $167,000 | -- |
Source: Public Records
Mortgage History
| Date | Status | Borrower | Loan Amount |
|---|---|---|---|
| Open | Bislimi Isen | $175,000 | |
| Previous Owner | American National Bk & Tr Co Of Chicago | $133,400 |
Source: Public Records
Tax History Compared to Growth
Tax History
| Year | Tax Paid | Tax Assessment Tax Assessment Total Assessment is a certain percentage of the fair market value that is determined by local assessors to be the total taxable value of land and additions on the property. | Land | Improvement |
|---|---|---|---|---|
| 2024 | $6,094 | $23,411 | $1,759 | $21,652 |
| 2023 | $5,374 | $23,411 | $1,759 | $21,652 |
| 2022 | $5,374 | $17,965 | $1,522 | $16,443 |
| 2021 | $5,153 | $17,964 | $1,521 | $16,443 |
| 2020 | $5,205 | $17,964 | $1,521 | $16,443 |
| 2019 | $5,126 | $17,686 | $1,378 | $16,308 |
| 2018 | $4,926 | $17,686 | $1,378 | $16,308 |
| 2017 | $5,018 | $17,686 | $1,378 | $16,308 |
| 2016 | $5,961 | $18,584 | $1,141 | $17,443 |
| 2015 | $5,906 | $18,584 | $1,141 | $17,443 |
| 2014 | $5,788 | $18,584 | $1,141 | $17,443 |
| 2013 | $5,381 | $18,743 | $1,141 | $17,602 |
Source: Public Records
Map
Nearby Homes
- 11028 Jodan Dr
- 5120 Deblin Ln
- 11000 Deblin Ln
- 11001 Deblin Ln Unit 203
- 5111 Deblin Ln Unit 3B
- 10816 Leclaire Ave
- 11152 S Lawler Ave
- 10720 Laramie Ave
- 4917 W 109th St Unit 202
- 10737 Long Ave
- 10724 Lawler Ave
- 10652 Laramie Ave
- 4829 W 109th St Unit 203
- 10713 Lawler Ave
- 11010 Central Ave Unit 3A
- 11000 Central Ave Unit 2C
- 10930 Central Ave Unit 1B
- 5128 W 113th St
- 10720 Lamon Ave
- 10624 Lawler Ave
- 11008 Jodan Dr
- 11004 Jodan Dr
- 11010 Jodan Dr
- 11002 Jodan Dr
- 10950 Jodan Dr
- 11012 Jodan Dr
- 10948 Jodan Dr
- 10948 Jodan Dr Unit 102
- 11020 Jodan Dr
- 10921 Cook Ave
- 10917 Cook Ave
- 10946 Jodan Dr
- 10925 Cook Ave
- 11022 Jodan Dr
- 10913 Cook Ave
- 10944 Jodan Dr
- 11024 Jodan Dr
- 10942 Jodan Dr
- 10942 Jodan Dr
- 10929 Cook Ave