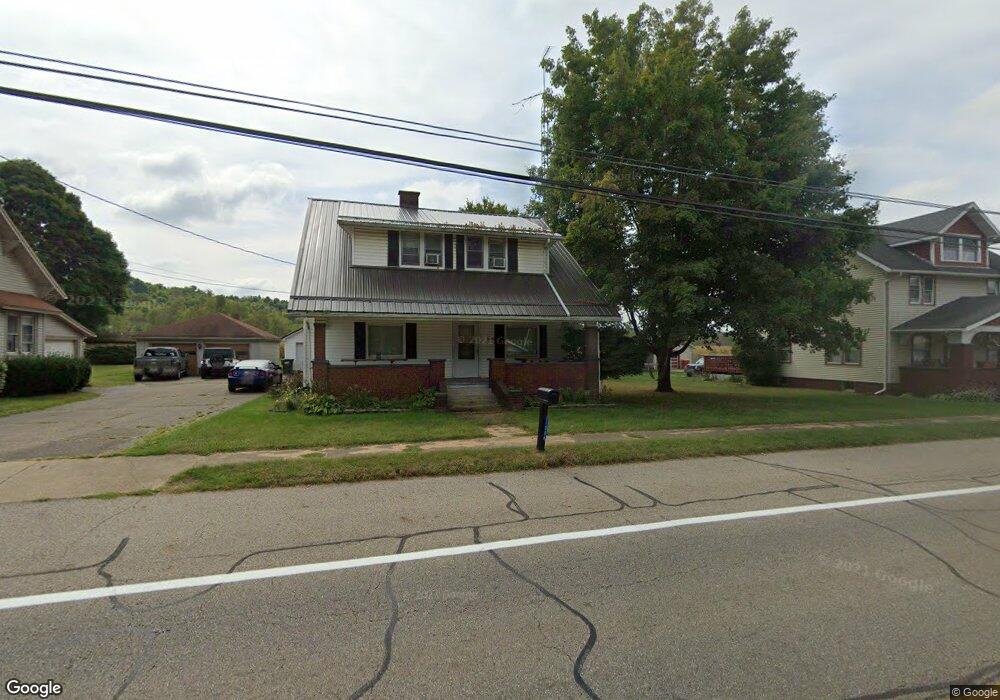
11006 Lincoln St SE East Canton, OH 44730
Estimated Value: $158,000 - $283,000
4
Beds
2
Baths
1,616
Sq Ft
$126/Sq Ft
Est. Value
About This Home
This home is located at 11006 Lincoln St SE, East Canton, OH 44730 and is currently estimated at $204,126, approximately $126 per square foot. 11006 Lincoln St SE is a home located in Stark County with nearby schools including Minerva Elementary School, Minerva Middle School, and Minerva High School.
Ownership History
Date
Name
Owned For
Owner Type
Purchase Details
Closed on
Oct 26, 2011
Sold by
Fannie Mae
Bought by
Hart David E
Current Estimated Value
Purchase Details
Closed on
Nov 30, 2010
Sold by
Brooks Galley M
Bought by
Federal National Mortgage Association
Purchase Details
Closed on
Jul 13, 2006
Sold by
Butts Kendel M
Bought by
Brooks Galley M
Purchase Details
Closed on
Feb 7, 2003
Sold by
Williams Elizabeth A and Williams Gary
Bought by
Brooks Galley M and Butts Kendel M
Home Financials for this Owner
Home Financials are based on the most recent Mortgage that was taken out on this home.
Original Mortgage
$80,733
Interest Rate
6.01%
Mortgage Type
FHA
Purchase Details
Closed on
Apr 30, 2002
Sold by
Estate Of Laura E Wolf
Bought by
Williams Elizabeth A
Create a Home Valuation Report for This Property
The Home Valuation Report is an in-depth analysis detailing your home's value as well as a comparison with similar homes in the area
Home Values in the Area
Average Home Value in this Area
Purchase History
| Date | Buyer | Sale Price | Title Company |
|---|---|---|---|
| Hart David E | $21,000 | Attorney | |
| Federal National Mortgage Association | $56,000 | Attorney | |
| Brooks Galley M | $36,300 | None Available | |
| Brooks Galley M | -- | -- | |
| Williams Elizabeth A | -- | -- |
Source: Public Records
Mortgage History
| Date | Status | Borrower | Loan Amount |
|---|---|---|---|
| Previous Owner | Brooks Galley M | $80,733 |
Source: Public Records
Tax History Compared to Growth
Tax History
| Year | Tax Paid | Tax Assessment Tax Assessment Total Assessment is a certain percentage of the fair market value that is determined by local assessors to be the total taxable value of land and additions on the property. | Land | Improvement |
|---|---|---|---|---|
| 2025 | -- | $51,320 | $12,080 | $39,240 |
| 2024 | -- | $51,320 | $12,080 | $39,240 |
| 2023 | $1,385 | $33,050 | $7,810 | $25,240 |
| 2022 | $1,354 | $33,050 | $7,810 | $25,240 |
| 2021 | $1,375 | $33,050 | $7,810 | $25,240 |
| 2020 | $1,378 | $30,870 | $7,140 | $23,730 |
| 2019 | $1,264 | $30,870 | $7,140 | $23,730 |
| 2018 | $1,344 | $30,870 | $7,140 | $23,730 |
| 2017 | $1,221 | $26,830 | $7,500 | $19,330 |
| 2016 | $1,389 | $30,430 | $7,500 | $22,930 |
| 2015 | $1,400 | $30,430 | $7,500 | $22,930 |
| 2014 | $1,290 | $26,220 | $6,480 | $19,740 |
| 2013 | $652 | $26,220 | $6,480 | $19,740 |
Source: Public Records
Map
Nearby Homes
- 10400 Lincoln St SE
- 2079 Parks Ave SE
- 12910 Lincoln St SE
- 0 Neimans Ave SE Unit 5149957
- 2260 Paris Ave SE
- 2030 Woodland Park Ave SE
- 756 Paris Ave SE
- 10072 Blade Rd NW
- 1990 Belfort Ave
- 9275 Blade Rd NW Unit 9
- 7145 Bluebird Rd NW
- 10074 Blade Rd NW Unit 4
- 9139 Blade Rd NW
- 7205 Mapleton St SE
- 14015 Stimmel St NE
- 0 Lincoln St SE Unit 5157308
- 0 Lincoln St SE Unit 5157344
- 0 Lincoln St SE Unit 5157290
- 8038 Avalon Rd NW
- 8225 Georgetown St
- 11020 Lincoln St SE
- 10988 Lincoln St SE
- 10976 Lincoln St SE
- 11034 Lincoln St SE
- 11007 Lincoln St SE
- 10993 Lincoln St SE
- 10962 Lincoln St SE
- 11046 Lincoln St SE
- 10979 Lincoln St SE
- 11033 Lincoln St SE
- 10969 Lincoln St SE
- 11047 Lincoln St SE
- 10944 Lincoln St SE
- 11070 Lincoln St SE
- 11056 Lincoln St SE
- 10955 Lincoln St SE
- 11059 Lincoln St SE
- 10943 Lincoln St SE
- 10928 Lincoln St SE
- 11071 Lincoln St SE