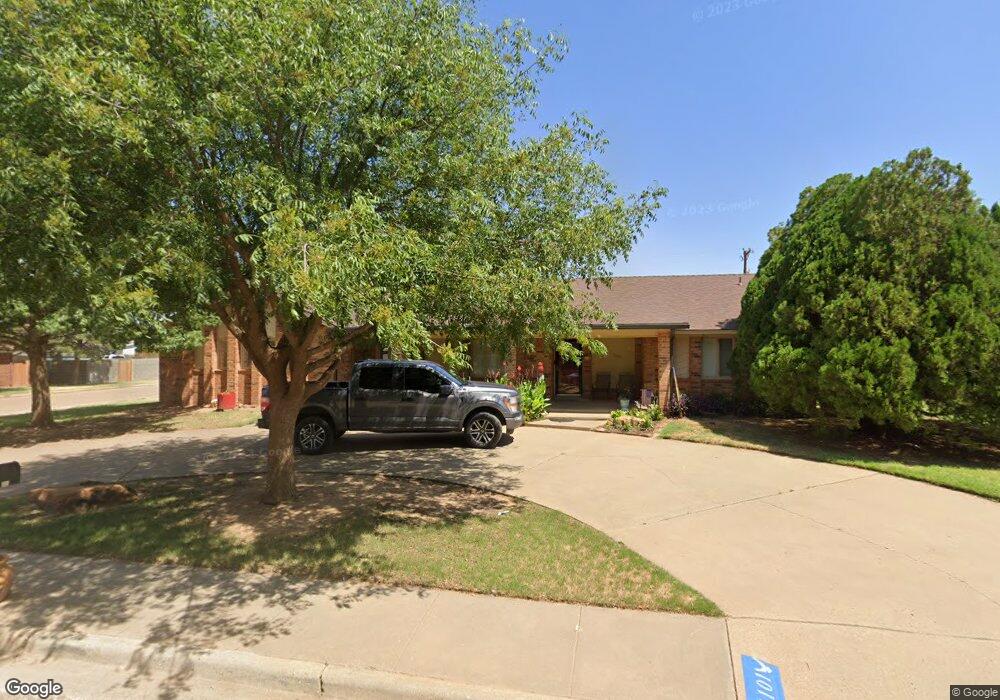
1101 15th St Shallowater, TX 79363
Estimated Value: $338,000 - $495,000
3
Beds
3
Baths
3,082
Sq Ft
$128/Sq Ft
Est. Value
About This Home
This home is located at 1101 15th St, Shallowater, TX 79363 and is currently estimated at $393,559, approximately $127 per square foot. 1101 15th St is a home located in Lubbock County with nearby schools including Shallowater Elementary School, Shallowwater Intermediate School, and Shallowater Middle School.
Ownership History
Date
Name
Owned For
Owner Type
Purchase Details
Closed on
Dec 21, 2012
Sold by
Stanton Joe Daniel and Stanton Sherry Lynn
Bought by
Blair Roy Lee and Blair Sandra Kay
Current Estimated Value
Home Financials for this Owner
Home Financials are based on the most recent Mortgage that was taken out on this home.
Original Mortgage
$198,412
Outstanding Balance
$136,688
Interest Rate
3.25%
Mortgage Type
FHA
Estimated Equity
$256,871
Purchase Details
Closed on
Sep 1, 1989
Bought by
Blair Roy Lee and Sandra Kay
Create a Home Valuation Report for This Property
The Home Valuation Report is an in-depth analysis detailing your home's value as well as a comparison with similar homes in the area
Home Values in the Area
Average Home Value in this Area
Purchase History
| Date | Buyer | Sale Price | Title Company |
|---|---|---|---|
| Blair Roy Lee | -- | Lubbock Abstract & Title Co | |
| Blair Roy Lee | -- | -- |
Source: Public Records
Mortgage History
| Date | Status | Borrower | Loan Amount |
|---|---|---|---|
| Open | Blair Roy Lee | $198,412 |
Source: Public Records
Tax History Compared to Growth
Tax History
| Year | Tax Paid | Tax Assessment Tax Assessment Total Assessment is a certain percentage of the fair market value that is determined by local assessors to be the total taxable value of land and additions on the property. | Land | Improvement |
|---|---|---|---|---|
| 2025 | $4,162 | $343,735 | $48,000 | $295,735 |
| 2024 | $4,162 | $361,478 | $48,000 | $313,478 |
| 2023 | $6,941 | $300,849 | $13,000 | $287,849 |
| 2022 | $5,949 | $300,849 | $13,000 | $287,849 |
| 2021 | $7,182 | $283,960 | $13,000 | $281,146 |
| 2020 | $6,591 | $258,145 | $13,000 | $245,145 |
| 2019 | $6,936 | $257,560 | $13,000 | $244,560 |
| 2018 | $6,418 | $234,145 | $13,000 | $221,145 |
| 2017 | $5,828 | $215,288 | $13,000 | $202,288 |
| 2016 | $6,199 | $229,002 | $13,000 | $216,002 |
| 2015 | $3,924 | $211,094 | $13,000 | $198,094 |
| 2014 | $3,924 | $196,568 | $13,000 | $183,568 |
Source: Public Records
Map
Nearby Homes