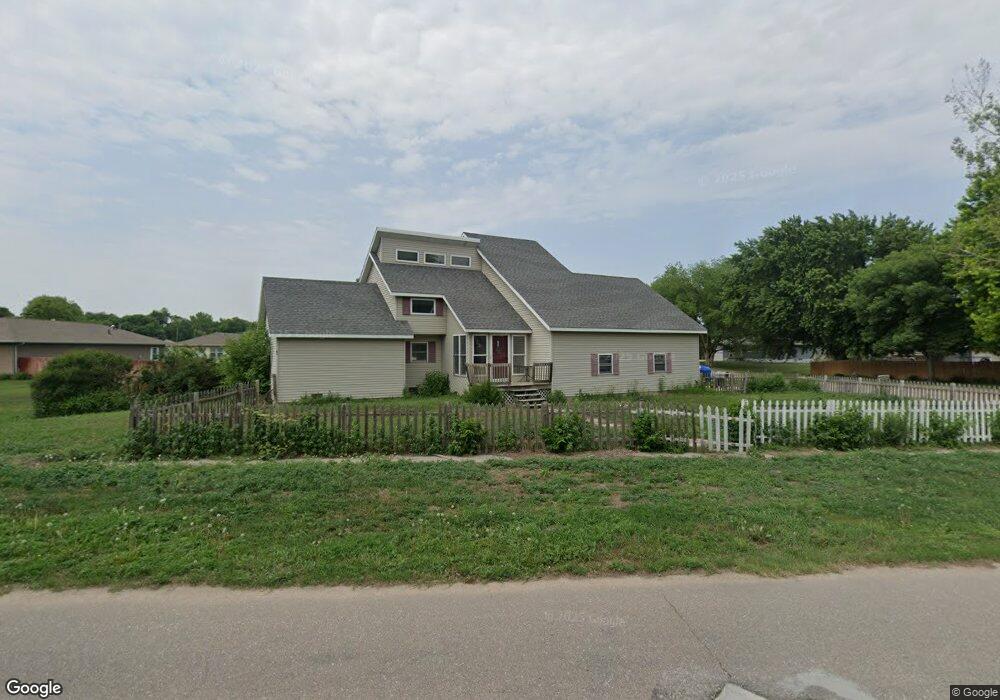
1101 20th St Central City, NE 68826
Estimated Value: $186,000 - $306,733
3
Beds
2
Baths
1,688
Sq Ft
$155/Sq Ft
Est. Value
About This Home
This home is located at 1101 20th St, Central City, NE 68826 and is currently estimated at $261,433, approximately $154 per square foot. 1101 20th St is a home located in Merrick County with nearby schools including Central City Elementary School, Central City Middle School, and Central City High School.
Ownership History
Date
Name
Owned For
Owner Type
Purchase Details
Closed on
Sep 20, 2008
Sold by
Hunt James K and Kjar Hunt Wanda L
Bought by
Schindler Austin G and Schindler Erin E
Current Estimated Value
Purchase Details
Closed on
Oct 14, 2005
Sold by
Petersen Joyce and Petersen Larry
Bought by
Hunt James K
Home Financials for this Owner
Home Financials are based on the most recent Mortgage that was taken out on this home.
Original Mortgage
$84,000
Interest Rate
5.65%
Mortgage Type
New Conventional
Create a Home Valuation Report for This Property
The Home Valuation Report is an in-depth analysis detailing your home's value as well as a comparison with similar homes in the area
Home Values in the Area
Average Home Value in this Area
Purchase History
| Date | Buyer | Sale Price | Title Company |
|---|---|---|---|
| Schindler Austin G | $120,000 | None Available | |
| Hunt James K | -- | -- | |
| Hunt James K | -- | None Available |
Source: Public Records
Mortgage History
| Date | Status | Borrower | Loan Amount |
|---|---|---|---|
| Previous Owner | Hunt James K | $84,000 |
Source: Public Records
Tax History Compared to Growth
Tax History
| Year | Tax Paid | Tax Assessment Tax Assessment Total Assessment is a certain percentage of the fair market value that is determined by local assessors to be the total taxable value of land and additions on the property. | Land | Improvement |
|---|---|---|---|---|
| 2024 | $2,315 | $202,390 | $49,005 | $153,385 |
| 2023 | $2,645 | $182,825 | $29,440 | $153,385 |
| 2022 | $3,004 | $182,825 | $29,440 | $153,385 |
| 2021 | $2,867 | $165,590 | $29,440 | $136,150 |
| 2020 | $2,779 | $160,355 | $29,440 | $130,915 |
| 2019 | $2,392 | $139,415 | $8,500 | $130,915 |
| 2018 | $2,400 | $139,415 | $8,500 | $130,915 |
| 2017 | $2,413 | $139,415 | $8,500 | $130,915 |
| 2016 | $2,104 | $121,170 | $8,500 | $112,670 |
| 2015 | $2,262 | $121,170 | $8,500 | $112,670 |
| 2014 | $2,351 | $121,170 | $8,500 | $112,670 |
| 2012 | $1,261 | $120,080 | $8,500 | $111,580 |
Source: Public Records
Map
Nearby Homes