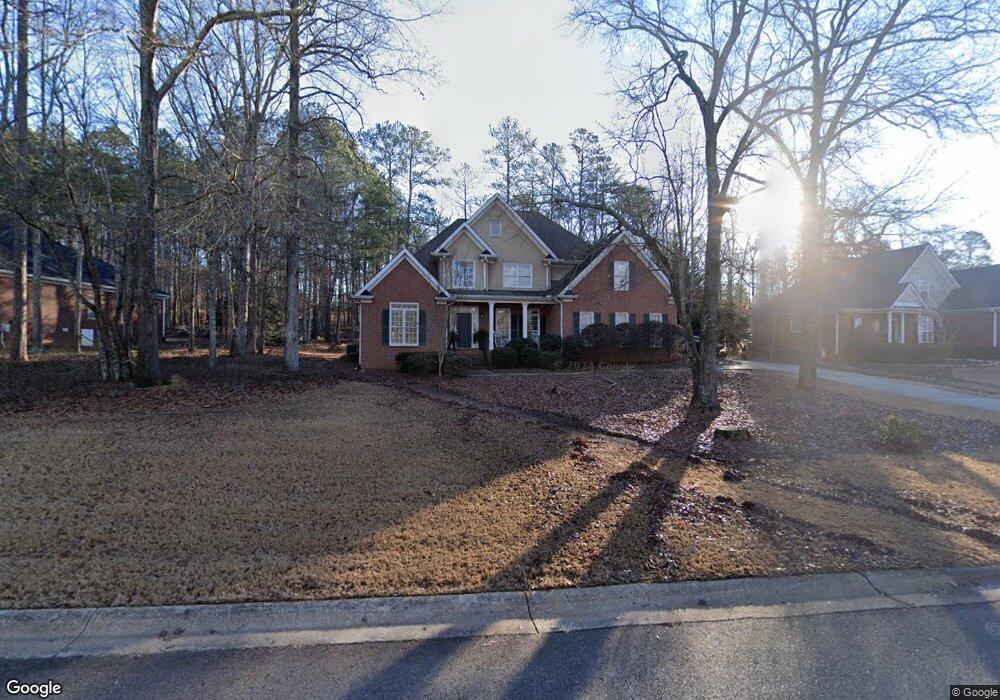
1101 Apalachee Trace Bishop, GA 30621
Estimated Value: $628,680 - $782,000
4
Beds
4
Baths
3,073
Sq Ft
$237/Sq Ft
Est. Value
About This Home
This home is located at 1101 Apalachee Trace, Bishop, GA 30621 and is currently estimated at $729,420, approximately $237 per square foot. 1101 Apalachee Trace is a home located in Oconee County with nearby schools including High Shoals Elementary School, Malcom Bridge Middle School, and North Oconee High School.
Ownership History
Date
Name
Owned For
Owner Type
Purchase Details
Closed on
Sep 7, 2012
Sold by
Eichbauer George N
Bought by
Lyle Joesph S and Ledford Lyle Miriam R
Current Estimated Value
Home Financials for this Owner
Home Financials are based on the most recent Mortgage that was taken out on this home.
Original Mortgage
$249,600
Outstanding Balance
$164,613
Interest Rate
2.9%
Mortgage Type
New Conventional
Estimated Equity
$564,807
Purchase Details
Closed on
Jun 14, 2006
Sold by
Not Provided
Bought by
Eichbauer George N and Eichbauer Julie M
Home Financials for this Owner
Home Financials are based on the most recent Mortgage that was taken out on this home.
Original Mortgage
$160,000
Interest Rate
6.57%
Mortgage Type
New Conventional
Purchase Details
Closed on
Feb 6, 2003
Sold by
Lane Creek Plantation Llc
Bought by
Saye Construction Company Inc
Create a Home Valuation Report for This Property
The Home Valuation Report is an in-depth analysis detailing your home's value as well as a comparison with similar homes in the area
Purchase History
| Date | Buyer | Sale Price | Title Company |
|---|---|---|---|
| Lyle Joesph S | $312,000 | -- | |
| Eichbauer George N | $361,900 | -- | |
| Saye Construction Company Inc | $351,000 | -- |
Source: Public Records
Mortgage History
| Date | Status | Borrower | Loan Amount |
|---|---|---|---|
| Open | Lyle Joesph S | $249,600 | |
| Previous Owner | Eichbauer George N | $160,000 |
Source: Public Records
Tax History
| Year | Tax Paid | Tax Assessment Tax Assessment Total Assessment is a certain percentage of the fair market value that is determined by local assessors to be the total taxable value of land and additions on the property. | Land | Improvement |
|---|---|---|---|---|
| 2025 | $3,789 | $213,580 | $36,000 | $177,580 |
| 2024 | $3,789 | $205,478 | $36,000 | $169,478 |
| 2023 | $3,841 | $200,830 | $32,000 | $168,830 |
| 2022 | $3,846 | $179,424 | $32,000 | $147,424 |
| 2021 | $3,537 | $153,111 | $32,000 | $121,111 |
| 2020 | $3,384 | $146,244 | $32,000 | $114,244 |
| 2019 | $3,310 | $143,082 | $32,000 | $111,082 |
| 2018 | $3,317 | $140,374 | $28,000 | $112,374 |
| 2017 | $3,216 | $136,121 | $28,000 | $108,121 |
| 2016 | $3,190 | $135,016 | $28,000 | $107,016 |
| 2015 | $3,168 | $133,803 | $28,000 | $105,803 |
| 2014 | $3,129 | $129,318 | $28,000 | $101,318 |
| 2013 | -- | $125,339 | $28,000 | $97,339 |
Source: Public Records
Map
Nearby Homes
- 1071 Riverhill Dr
- 1041 Riverhill Dr
- 1070 Riverhill Dr
- 1410 Lane Creek Dr
- 1140 Riverhill Dr
- 1241 Riverhill Dr
- 1251 Riverhill Dr
- 1311 Riverhill Dr
- 1070 Lane Creek Terrace
- 2841 Cole Springs Rd
- 2821 Cole Springs Rd
- 1040 Peacock Dr
- 246 Jefferson Rd
- 1691 Snows Mill Rd
- 2100 Rays Church Rd
- 2736 Jones Holly Rd
- 247 Shadyfield Ln
- 1070 Lexington Ct
- 1121 Apalachee Trace
- Lot 64C Apalachee Trace
- Lot 66C Apalachee Trace
- Lot 65C Apalachee Trace
- Lot 68 Apalachee Trace
- 1011 Apalachee Trace
- 0 Apalachee Trace
- Lot 56C Apalachee Trace
- Lot 61C Apalachee Trace
- Lot 57C Apalachee Trace
- Lot 55C Apalachee Trace
- 1010 Apalachee Trace
- Lot 62C Apalachee Trace
- 1081 Apalachee Trace
- 1131 Apalachee Trace
- 1051 Apalachee Trace
- 1090 Apalachee Trace
- 1141 Apalachee Trace
- 1031 Apalachee Trace
- 1110 Apalachee Trace