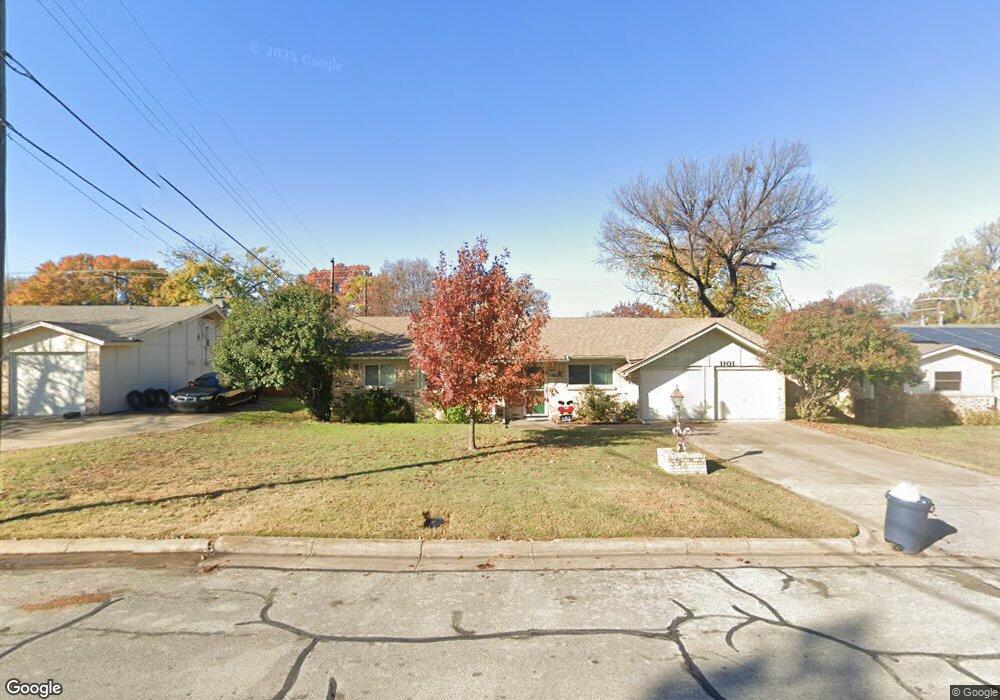
1101 Belle St Bedford, TX 76022
Estimated Value: $195,000 - $291,000
3
Beds
2
Baths
1,166
Sq Ft
$216/Sq Ft
Est. Value
About This Home
This home is located at 1101 Belle St, Bedford, TX 76022 and is currently estimated at $251,855, approximately $215 per square foot. 1101 Belle St is a home located in Tarrant County with nearby schools including Stonegate Elementary School, Hurst J High School, and L.D. Bell High School.
Ownership History
Date
Name
Owned For
Owner Type
Purchase Details
Closed on
Jun 21, 2002
Sold by
Vystrcil Vicki W Lerma
Bought by
Aronhalt Jane M
Current Estimated Value
Home Financials for this Owner
Home Financials are based on the most recent Mortgage that was taken out on this home.
Original Mortgage
$94,024
Outstanding Balance
$39,980
Interest Rate
6.89%
Mortgage Type
FHA
Estimated Equity
$211,875
Purchase Details
Closed on
Jun 19, 2000
Sold by
Nora Lee Ables Revocable Living Trust
Bought by
Lerma Vicki W
Home Financials for this Owner
Home Financials are based on the most recent Mortgage that was taken out on this home.
Original Mortgage
$64,000
Interest Rate
8.5%
Purchase Details
Closed on
Dec 18, 1997
Sold by
Haden Laura Lynn
Bought by
Nora Lee Ables Revocable Living Trust
Create a Home Valuation Report for This Property
The Home Valuation Report is an in-depth analysis detailing your home's value as well as a comparison with similar homes in the area
Home Values in the Area
Average Home Value in this Area
Purchase History
| Date | Buyer | Sale Price | Title Company |
|---|---|---|---|
| Aronhalt Jane M | -- | Stewart Title | |
| Lerma Vicki W | -- | First American Title Co | |
| Nora Lee Ables Revocable Living Trust | -- | American Title Company |
Source: Public Records
Mortgage History
| Date | Status | Borrower | Loan Amount |
|---|---|---|---|
| Open | Aronhalt Jane M | $94,024 | |
| Previous Owner | Lerma Vicki W | $64,000 |
Source: Public Records
Tax History Compared to Growth
Tax History
| Year | Tax Paid | Tax Assessment Tax Assessment Total Assessment is a certain percentage of the fair market value that is determined by local assessors to be the total taxable value of land and additions on the property. | Land | Improvement |
|---|---|---|---|---|
| 2025 | $501 | $171,560 | $55,000 | $116,560 |
| 2024 | $501 | $171,560 | $55,000 | $116,560 |
| 2023 | $501 | $153,557 | $35,000 | $118,557 |
| 2022 | $2,963 | $135,677 | $35,000 | $100,677 |
| 2021 | $3,140 | $133,286 | $35,000 | $98,286 |
| 2020 | $3,082 | $144,580 | $35,000 | $109,580 |
| 2019 | $2,863 | $148,579 | $35,000 | $113,579 |
| 2018 | $1,039 | $107,146 | $16,000 | $91,146 |
| 2017 | $2,356 | $133,053 | $16,000 | $117,053 |
| 2016 | $2,142 | $107,794 | $16,000 | $91,794 |
| 2015 | $1,747 | $80,500 | $15,000 | $65,500 |
| 2014 | $1,747 | $80,500 | $15,000 | $65,500 |
Source: Public Records
Map
Nearby Homes
- 1220 Norwood Dr
- 1136 Simpson Dr
- 116 Oakhurst Dr
- 905 Brown Trail
- 1348 Norwood Dr
- 1337 Harrison Ln
- 1352 Simpson Dr
- 344 Bedford Ct E
- 341 Hurst Dr
- 409 Vicki Place
- 113 Sunnyvale Terrace
- 1008 Russell Ln
- 1236 King Dr
- 1016 Keith Dr
- 420 Bedford Ct W
- 802 Brown Trail
- 803 Glenda Dr
- 49 Coffee Tavern Rd
- 501 Merrill Dr
- 849 Russell Ln
- 1105 Belle St
- 240 Belle St
- 1164 Valley View Dr
- 1160 Valley View Dr
- 1100 Belle St
- 251 Belle St
- 244 Belle St
- 1104 Belle St
- 1168 Valley View Dr
- 1156 Valley View Dr
- 1108 Belle St
- 1113 Belle St
- 255 Belle St
- 1200 Valley View Ct
- 248 Belle St
- 1112 Belle St
- 1152 Valley View Dr
- 252 Belle St
- 1117 Belle St
- 259 Belle St