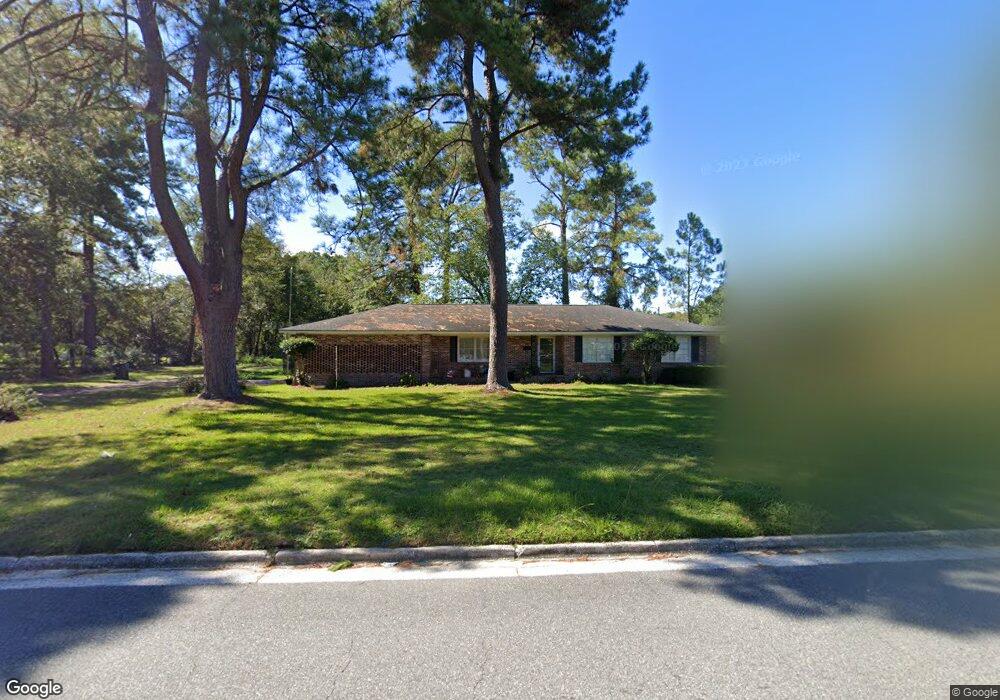
1101 Darling Ave Waycross, GA 31501
Estimated Value: $160,000 - $187,000
3
Beds
2
Baths
1,651
Sq Ft
$104/Sq Ft
Est. Value
About This Home
This home is located at 1101 Darling Ave, Waycross, GA 31501 and is currently estimated at $171,414, approximately $103 per square foot. 1101 Darling Ave is a home located in Ware County with nearby schools including Center Elementary School, Waycross Middle School, and Ware County High School.
Ownership History
Date
Name
Owned For
Owner Type
Purchase Details
Closed on
Jun 6, 2022
Sold by
Nelson Alvin
Bought by
Nelson Carlos
Current Estimated Value
Home Financials for this Owner
Home Financials are based on the most recent Mortgage that was taken out on this home.
Original Mortgage
$115,087
Outstanding Balance
$109,506
Interest Rate
5.27%
Mortgage Type
VA
Estimated Equity
$61,908
Purchase Details
Closed on
Mar 30, 2017
Sold by
Lathbury Sean L
Bought by
Nelson Alvin and Nelson Alisa
Home Financials for this Owner
Home Financials are based on the most recent Mortgage that was taken out on this home.
Original Mortgage
$86,925
Interest Rate
4.1%
Mortgage Type
New Conventional
Purchase Details
Closed on
Sep 23, 2015
Sold by
Davis Minnie H
Bought by
Lathbury Sean
Home Financials for this Owner
Home Financials are based on the most recent Mortgage that was taken out on this home.
Original Mortgage
$62,100
Interest Rate
3.88%
Mortgage Type
New Conventional
Purchase Details
Closed on
Jun 18, 2015
Sold by
Davis S Eugene
Bought by
Davos Minnie H
Create a Home Valuation Report for This Property
The Home Valuation Report is an in-depth analysis detailing your home's value as well as a comparison with similar homes in the area
Home Values in the Area
Average Home Value in this Area
Purchase History
| Date | Buyer | Sale Price | Title Company |
|---|---|---|---|
| Nelson Carlos | $112,500 | -- | |
| Nelson Alvin | $91,500 | -- | |
| Lathbury Sean | $69,000 | -- | |
| Davos Minnie H | -- | -- |
Source: Public Records
Mortgage History
| Date | Status | Borrower | Loan Amount |
|---|---|---|---|
| Open | Nelson Carlos | $115,087 | |
| Previous Owner | Nelson Alvin | $86,925 | |
| Previous Owner | Lathbury Sean | $62,100 |
Source: Public Records
Tax History Compared to Growth
Tax History
| Year | Tax Paid | Tax Assessment Tax Assessment Total Assessment is a certain percentage of the fair market value that is determined by local assessors to be the total taxable value of land and additions on the property. | Land | Improvement |
|---|---|---|---|---|
| 2024 | $1,546 | $68,142 | $2,070 | $66,072 |
| 2023 | $1,578 | $46,806 | $1,510 | $45,296 |
| 2022 | $1,865 | $46,806 | $1,510 | $45,296 |
| 2021 | $1,756 | $40,614 | $1,510 | $39,104 |
| 2020 | $1,447 | $33,199 | $1,510 | $31,689 |
| 2019 | $1,336 | $30,222 | $1,510 | $28,712 |
| 2018 | $1,298 | $29,076 | $1,510 | $27,566 |
| 2017 | $1,142 | $29,076 | $1,510 | $27,566 |
| 2016 | $1,142 | $29,076 | $1,510 | $27,566 |
| 2015 | $929 | $29,076 | $1,510 | $27,566 |
| 2014 | -- | $29,076 | $1,510 | $27,566 |
| 2013 | -- | $29,076 | $1,509 | $27,566 |
Source: Public Records
Map
Nearby Homes
- 0 Beville St
- 515 Summit St
- 1301 Riverside Ave
- 2022 Pioneer St
- 2120 Tebeau St
- .22 Alice St
- 00 Pineview Dr
- 0 Pineview Dr
- 2202 Pioneer St
- 2312 Spurgeon St
- 1504 Habersham Dr
- 511 Riverside Dr
- 2509 Tebeau St
- 607 Linden Dr
- 1405 Grove Ave
- 301 Riverside Dr
- 904 Golfview Dr
- 1701 Satilla Blvd
- 1408 Bethune St
- 310 Butler St
- 2605 2607 & 2609 Tebeau
- 1003 Darling Ave
- 520 Hanover St
- 1006 Darling Ave
- 518 Hanover St
- 1001 Darling Ave
- 515 Hanover Dr
- 604 Beville St
- 515 Hanover St
- 516 Hanover St
- 1000 Darling Ave
- 606 Beville St
- 608 Beville St
- 512 Beville St
- 512 Beville St Unit A&B
- 514 Hanover St
- 510 Beville St
- 905 Darling Ave
- 605 Beville St
- 610 Beville St