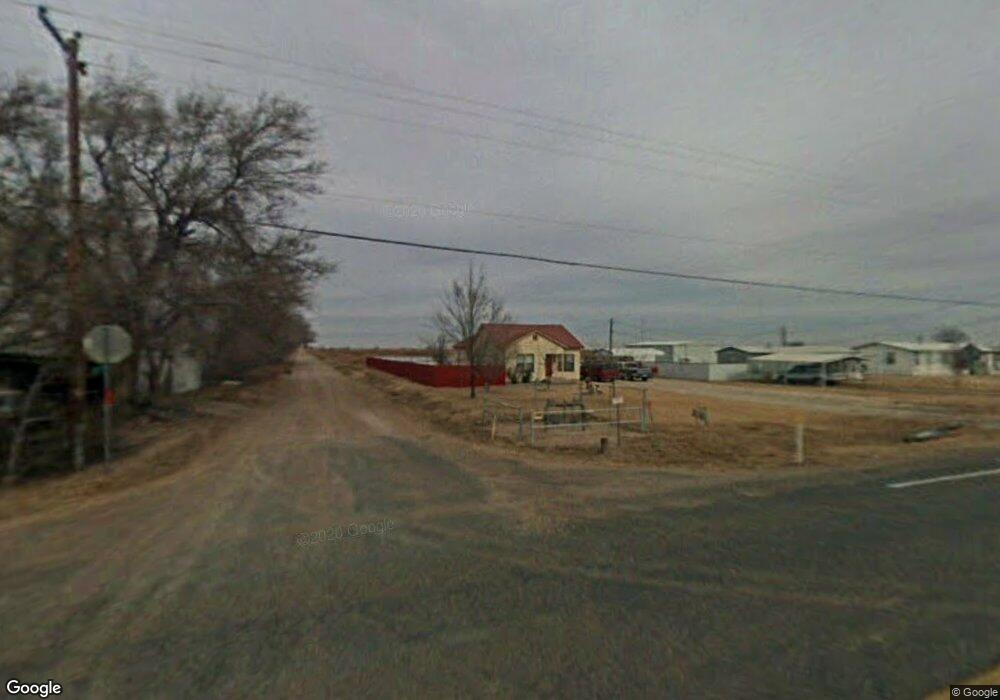
1101 E 34th St Plainview, TX 79072
Estimated Value: $75,000 - $118,000
3
Beds
1
Bath
1,364
Sq Ft
$75/Sq Ft
Est. Value
About This Home
This home is located at 1101 E 34th St, Plainview, TX 79072 and is currently estimated at $102,187, approximately $74 per square foot. 1101 E 34th St is a home located in Hale County with nearby schools including Thunderbird Elementary School, Coronado Middle School, and Plainview High School.
Ownership History
Date
Name
Owned For
Owner Type
Purchase Details
Closed on
Jul 25, 2025
Sold by
Davila Lee
Bought by
Cortez Ilvia
Current Estimated Value
Purchase Details
Closed on
Jun 3, 2016
Sold by
Gonzalez Cipriano and Gonzalez Deanna Cervantes
Bought by
Davila Lee and Cortez Ilvia
Home Financials for this Owner
Home Financials are based on the most recent Mortgage that was taken out on this home.
Original Mortgage
$60,000
Interest Rate
3.59%
Mortgage Type
Purchase Money Mortgage
Create a Home Valuation Report for This Property
The Home Valuation Report is an in-depth analysis detailing your home's value as well as a comparison with similar homes in the area
Purchase History
| Date | Buyer | Sale Price | Title Company |
|---|---|---|---|
| Cortez Ilvia | -- | None Listed On Document | |
| Davila Lee | -- | None Available |
Source: Public Records
Mortgage History
| Date | Status | Borrower | Loan Amount |
|---|---|---|---|
| Previous Owner | Davila Lee | $60,000 |
Source: Public Records
Tax History
| Year | Tax Paid | Tax Assessment Tax Assessment Total Assessment is a certain percentage of the fair market value that is determined by local assessors to be the total taxable value of land and additions on the property. | Land | Improvement |
|---|---|---|---|---|
| 2025 | $448 | $63,710 | $2,225 | $61,485 |
| 2024 | $1,130 | $63,710 | $2,225 | $61,485 |
| 2023 | $983 | $63,710 | $2,225 | $61,485 |
| 2022 | $912 | $49,761 | $2,225 | $47,536 |
| 2021 | $832 | $41,116 | $2,225 | $38,891 |
| 2020 | $708 | $41,116 | $2,225 | $38,891 |
| 2019 | $741 | $41,116 | $2,225 | $38,891 |
| 2018 | $741 | $41,116 | $2,225 | $38,891 |
| 2017 | $705 | $41,116 | $2,225 | $38,891 |
| 2016 | $646 | $41,116 | $2,225 | $38,891 |
| 2015 | -- | $41,116 | $2,225 | $38,891 |
| 2014 | -- | $41,932 | $2,225 | $39,707 |
Source: Public Records
Map
Nearby Homes
Your Personal Tour Guide
Ask me questions while you tour the home.