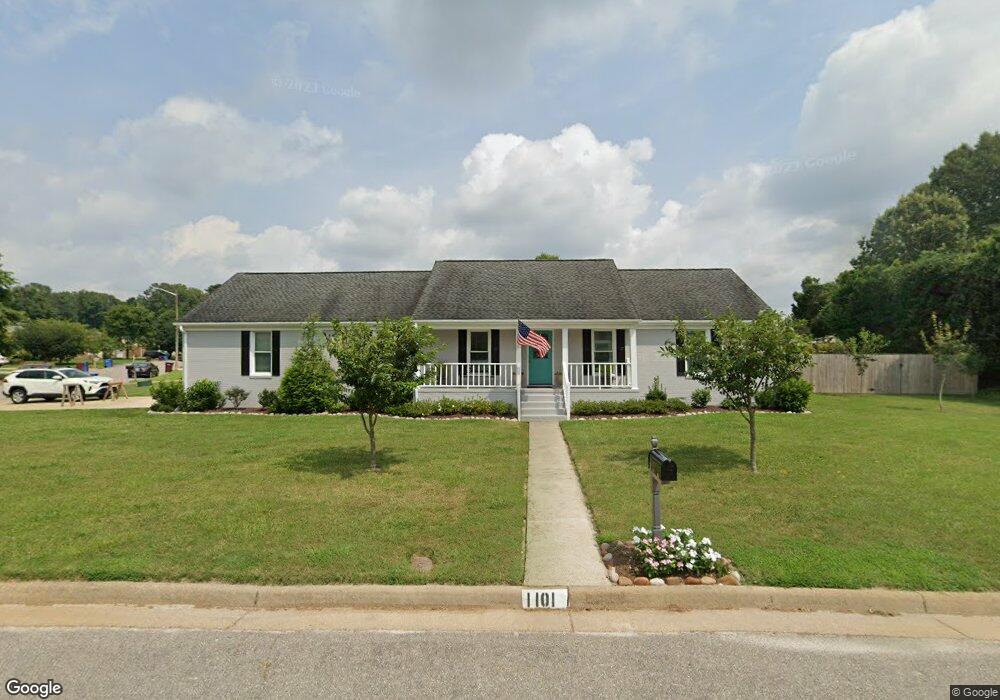
1101 Fernham Ln Chesapeake, VA 23322
Pleasant Grove West NeighborhoodEstimated Value: $490,000 - $520,530
4
Beds
2
Baths
2,108
Sq Ft
$240/Sq Ft
Est. Value
About This Home
This home is located at 1101 Fernham Ln, Chesapeake, VA 23322 and is currently estimated at $505,633, approximately $239 per square foot. 1101 Fernham Ln is a home located in Chesapeake City with nearby schools including Butts Road Primary School, Butts Road Intermediate School, and Hickory Middle School.
Ownership History
Date
Name
Owned For
Owner Type
Purchase Details
Closed on
Mar 9, 2020
Sold by
The Estate Of Barbara F Eck
Bought by
Cochran Jimmie S and Cochran Joyce J
Current Estimated Value
Home Financials for this Owner
Home Financials are based on the most recent Mortgage that was taken out on this home.
Original Mortgage
$85,000
Outstanding Balance
$75,280
Interest Rate
3.5%
Mortgage Type
New Conventional
Estimated Equity
$430,353
Purchase Details
Closed on
Apr 29, 2016
Sold by
Jones Louis Ray
Bought by
Eck Barbara F
Home Financials for this Owner
Home Financials are based on the most recent Mortgage that was taken out on this home.
Original Mortgage
$322,050
Interest Rate
3.71%
Mortgage Type
New Conventional
Purchase Details
Closed on
Jan 14, 2016
Sold by
Selene Finance Lp
Bought by
Jones Louis Ray
Purchase Details
Closed on
Dec 17, 2015
Sold by
Equity Trustees Llc A Virginia Limited L and Biggs Michael R
Bought by
Selene Finance Lp
Create a Home Valuation Report for This Property
The Home Valuation Report is an in-depth analysis detailing your home's value as well as a comparison with similar homes in the area
Home Values in the Area
Average Home Value in this Area
Purchase History
| Date | Buyer | Sale Price | Title Company |
|---|---|---|---|
| Cochran Jimmie S | $338,000 | Attorney | |
| Eck Barbara F | $339,000 | Sun Title | |
| Jones Louis Ray | $201,300 | Sun Title Inc | |
| Selene Finance Lp | $246,645 | None Available |
Source: Public Records
Mortgage History
| Date | Status | Borrower | Loan Amount |
|---|---|---|---|
| Open | Cochran Jimmie S | $85,000 | |
| Previous Owner | Eck Barbara F | $322,050 |
Source: Public Records
Tax History Compared to Growth
Tax History
| Year | Tax Paid | Tax Assessment Tax Assessment Total Assessment is a certain percentage of the fair market value that is determined by local assessors to be the total taxable value of land and additions on the property. | Land | Improvement |
|---|---|---|---|---|
| 2025 | $4,610 | $477,100 | $185,000 | $292,100 |
| 2024 | $4,610 | $456,400 | $185,000 | $271,400 |
| 2023 | $4,009 | $429,800 | $175,000 | $254,800 |
| 2022 | $3,939 | $390,000 | $150,000 | $240,000 |
| 2021 | $3,817 | $363,500 | $135,000 | $228,500 |
| 2020 | $3,577 | $340,700 | $120,000 | $220,700 |
| 2019 | $2,668 | $338,800 | $120,000 | $218,800 |
| 2018 | $3,462 | $329,700 | $120,000 | $209,700 |
| 2017 | $3,389 | $322,800 | $120,000 | $202,800 |
| 2016 | $3,095 | $294,800 | $110,000 | $184,800 |
| 2015 | $3,007 | $286,400 | $105,000 | $181,400 |
| 2014 | $3,007 | $286,400 | $105,000 | $181,400 |
Source: Public Records
Map
Nearby Homes
- 701 Donnington Dr
- 711 Villa Dr
- 702 Aspinock St
- 617 Valor Ct
- 701 Sundon Ct
- 544 Aylesbury Dr
- 432 Trotters Ln
- 854 Jo Anne Cir
- 1108 Stanmore Ct
- 612 Blackthorne Ct
- 828 Woodstream Way
- 904 Easton Ct
- 718 Beckley Ln
- 1024 Wymers Ct
- 1101 Somerton Ln
- 1213 Lakeford Place
- 733 Hawkhurst Dr
- 900 Brookedale Ct
- 724 Hawkhurst Dr
- 1008 Eddington Ct
- 629 Blackthorne Dr
- 1105 Fernham Ln
- 1100 Fernham Ln
- 624 Blackthorne Dr
- 700 Waterstock Ct
- 1104 Fernham Ln
- 628 Blackthorne Dr
- 633 Blackthorne Dr
- 620 Blackthorne Dr
- 616 Blackthorne Dr
- 702 Waterstock Ct
- 600 Marston Dr
- 701 Waterstock Ct
- 632 Blackthorne Dr
- 1108 Fernham Ln
- 604 Marston Dr
- 613 Blackthorne Dr
- 639 Blackthorne Dr
- 612 Blackthorne Dr
- 608 Marston Dr