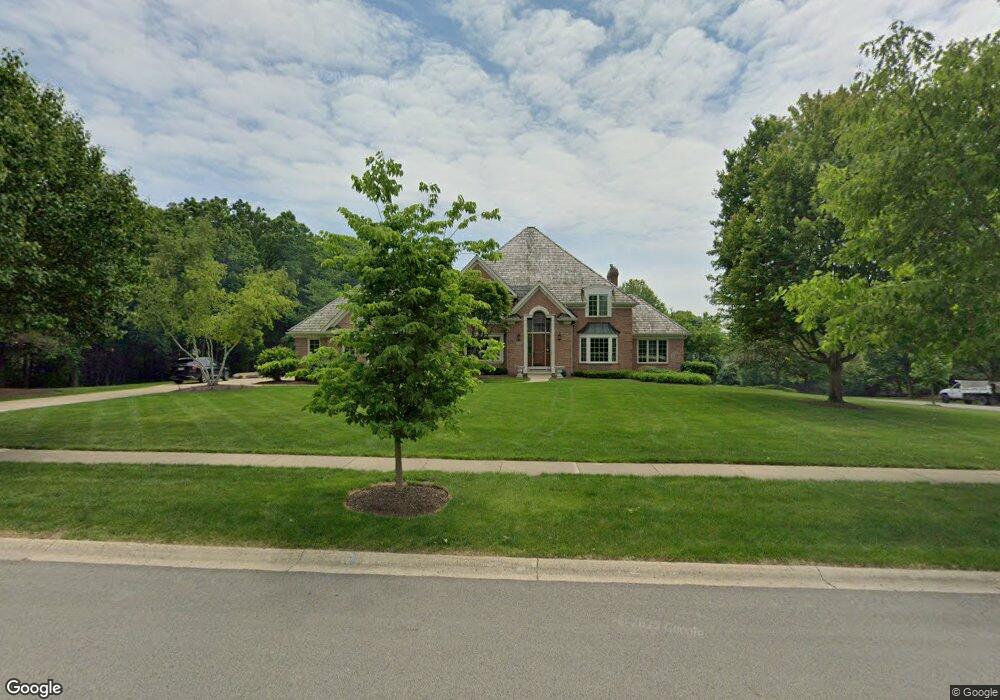
1101 Fox Glen Dr Unit 2 Saint Charles, IL 60174
Dunham Castle NeighborhoodEstimated Value: $1,165,029 - $1,303,000
4
Beds
5
Baths
4,739
Sq Ft
$257/Sq Ft
Est. Value
About This Home
This home is located at 1101 Fox Glen Dr Unit 2, Saint Charles, IL 60174 and is currently estimated at $1,219,757, approximately $257 per square foot. 1101 Fox Glen Dr Unit 2 is a home located in Kane County with nearby schools including Norton Creek Elementary School, Wredling Middle School, and St Charles East High School.
Ownership History
Date
Name
Owned For
Owner Type
Purchase Details
Closed on
Sep 14, 2009
Sold by
Oreilly Todd A and Bockisch Elaine
Bought by
Bockisch Elaine and Elaine Trust Bockish
Current Estimated Value
Purchase Details
Closed on
Feb 13, 1995
Sold by
Cronin Custom Homes Inc
Bought by
Oreilly Todd A and Bockisch Elaine
Home Financials for this Owner
Home Financials are based on the most recent Mortgage that was taken out on this home.
Original Mortgage
$230,000
Interest Rate
9.21%
Purchase Details
Closed on
Aug 2, 1994
Sold by
Harrison Construction Inc
Bought by
Cronin Custom Homes Inc
Home Financials for this Owner
Home Financials are based on the most recent Mortgage that was taken out on this home.
Original Mortgage
$250,000
Interest Rate
8.25%
Create a Home Valuation Report for This Property
The Home Valuation Report is an in-depth analysis detailing your home's value as well as a comparison with similar homes in the area
Home Values in the Area
Average Home Value in this Area
Purchase History
| Date | Buyer | Sale Price | Title Company |
|---|---|---|---|
| Bockisch Elaine | -- | None Available | |
| Oreilly Todd A | $535,000 | Chicago Title | |
| Cronin Custom Homes Inc | $107,500 | Chicago Title Insurance Co |
Source: Public Records
Mortgage History
| Date | Status | Borrower | Loan Amount |
|---|---|---|---|
| Closed | Oreilly Todd A | $230,000 | |
| Previous Owner | Cronin Custom Homes Inc | $250,000 | |
| Closed | Oreilly Todd A | $200,000 |
Source: Public Records
Tax History Compared to Growth
Tax History
| Year | Tax Paid | Tax Assessment Tax Assessment Total Assessment is a certain percentage of the fair market value that is determined by local assessors to be the total taxable value of land and additions on the property. | Land | Improvement |
|---|---|---|---|---|
| 2024 | $25,636 | $353,355 | $93,612 | $259,743 |
| 2023 | $24,671 | $316,258 | $83,784 | $232,474 |
| 2022 | $21,467 | $271,873 | $75,876 | $195,997 |
| 2021 | $20,646 | $259,149 | $72,325 | $186,824 |
| 2020 | $22,300 | $276,958 | $75,710 | $201,248 |
| 2019 | $21,911 | $271,474 | $74,211 | $197,263 |
| 2018 | $22,132 | $272,823 | $79,321 | $193,502 |
| 2017 | $21,296 | $260,160 | $76,609 | $183,551 |
| 2016 | $25,573 | $285,929 | $83,158 | $202,771 |
| 2015 | -- | $299,604 | $82,261 | $217,343 |
| 2014 | -- | $259,995 | $82,261 | $177,734 |
| 2013 | -- | $270,909 | $83,084 | $187,825 |
Source: Public Records
Map
Nearby Homes
- 3001 Glen Eagles Ct
- 34W791 Army Trail Rd
- 2450 Persimmon Dr
- lot 012 Tuscola Ave
- 5N092 Grove Ave
- 875 Country Club Rd
- 34W789 S James Dr
- 55 Whittington Course
- 5N847 Surrey Rd
- 92 Whittington Course
- 34W744 N James Dr
- 33 Stirrup Cup Ct
- Lot 1 in Block 2 Norway Maple Addition To St Charles
- Lot 4 Mosedale St
- Lot 2 in Block 2 Norway Maple Addition To St Charles
- 12 Highgate Ct
- 4308 Royal Windyne Ct
- 5N024 Il Route 31
- 135 Thornhill Farm Ln Unit 1
- 6N323 Riverside Dr
- 3021 Glen Eagles Ct Unit 2
- 3018 Glenbriar Dr
- 1021 Fox Glen Dr
- 3017 Glen Eagles Ct
- 1110 Fox Glen Dr
- 1102 Fox Glen Dr
- 1018 Fox Glen Dr
- 1013 Fox Glen Dr
- 1118 Fox Glen Dr Unit 2
- 3014 Glen Eagles Ct Unit 2
- 1010 Fox Glen Dr
- 3013 Glen Eagles Ct
- 1202 Fox Glen Dr
- 1005 Fox Glen Dr
- 34W685 Army Trail Rd
- 3010 Glen Eagles Ct Unit 2
- 1002 Fox Glen Dr
- 1002 Glenbriar Ct
- 1209 Fox Glen Dr Unit 2
- 1210 Fox Glen Dr