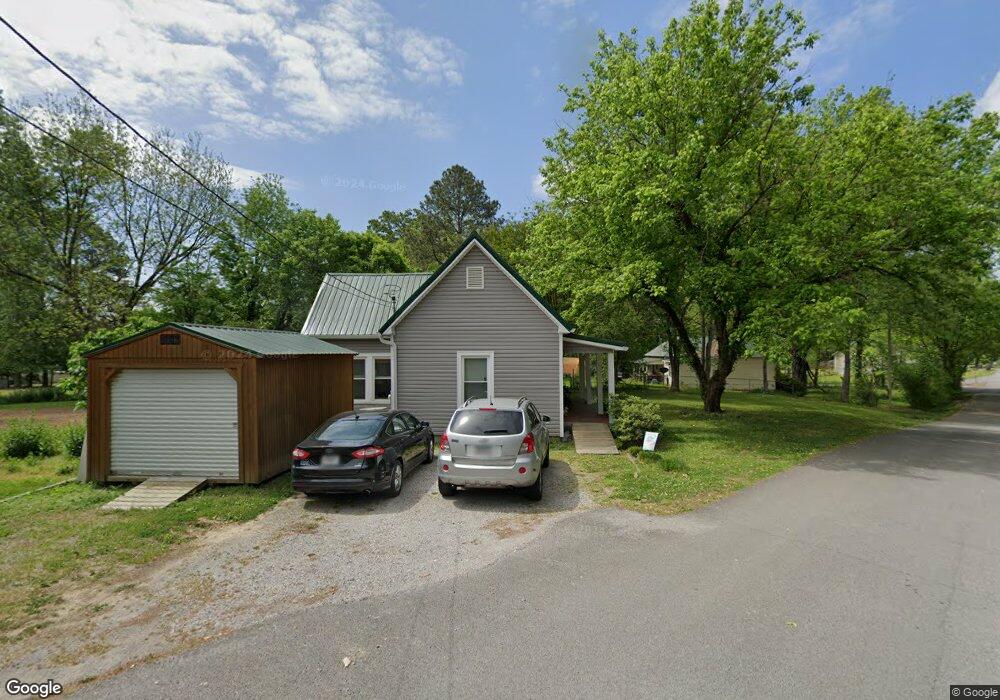
1101 Magnolia St La Fayette, GA 30728
Estimated Value: $152,676 - $187,000
--
Bed
1
Bath
1,056
Sq Ft
$156/Sq Ft
Est. Value
About This Home
This home is located at 1101 Magnolia St, La Fayette, GA 30728 and is currently estimated at $164,919, approximately $156 per square foot. 1101 Magnolia St is a home located in Walker County with nearby schools including Gilbert Elementary School, Lafayette Middle School, and Lafayette High School.
Ownership History
Date
Name
Owned For
Owner Type
Purchase Details
Closed on
May 19, 2016
Sold by
Griffin Pamela K
Bought by
Russell Tabitha
Current Estimated Value
Home Financials for this Owner
Home Financials are based on the most recent Mortgage that was taken out on this home.
Original Mortgage
$33,873
Outstanding Balance
$2,655
Interest Rate
3.59%
Mortgage Type
New Conventional
Estimated Equity
$162,264
Purchase Details
Closed on
Nov 12, 2007
Sold by
Snider Nora
Bought by
Griffin Pamela K
Purchase Details
Closed on
Jun 4, 1990
Sold by
Snider Nora
Bought by
Green Stella
Purchase Details
Closed on
Jun 1, 1990
Sold by
Green Stella
Bought by
Snider Nora
Purchase Details
Closed on
Jul 24, 1984
Sold by
Houston Thelma
Bought by
Green Cicero and Green Stella
Purchase Details
Closed on
Jan 1, 1972
Bought by
Houston Thelma
Create a Home Valuation Report for This Property
The Home Valuation Report is an in-depth analysis detailing your home's value as well as a comparison with similar homes in the area
Home Values in the Area
Average Home Value in this Area
Purchase History
| Date | Buyer | Sale Price | Title Company |
|---|---|---|---|
| Russell Tabitha | $30,000 | -- | |
| Griffin Pamela K | -- | -- | |
| Green Stella | -- | -- | |
| Snider Nora | $11,000 | -- | |
| Green Cicero | -- | -- | |
| Houston Thelma | -- | -- |
Source: Public Records
Mortgage History
| Date | Status | Borrower | Loan Amount |
|---|---|---|---|
| Open | Russell Tabitha | $33,873 |
Source: Public Records
Tax History Compared to Growth
Tax History
| Year | Tax Paid | Tax Assessment Tax Assessment Total Assessment is a certain percentage of the fair market value that is determined by local assessors to be the total taxable value of land and additions on the property. | Land | Improvement |
|---|---|---|---|---|
| 2024 | $1,380 | $57,948 | $4,973 | $52,975 |
| 2023 | $1,352 | $55,077 | $4,973 | $50,104 |
| 2022 | $1,235 | $46,916 | $4,144 | $42,772 |
| 2021 | $437 | $14,886 | $4,144 | $10,742 |
| 2020 | $419 | $13,648 | $4,144 | $9,504 |
| 2019 | $419 | $13,650 | $4,144 | $9,506 |
| 2018 | $406 | $13,650 | $4,144 | $9,506 |
| 2017 | $405 | $13,650 | $4,144 | $9,506 |
| 2016 | $321 | $13,650 | $4,144 | $9,506 |
| 2015 | $385 | $15,316 | $4,120 | $11,196 |
| 2014 | $371 | $15,316 | $4,120 | $11,196 |
| 2013 | -- | $15,316 | $4,120 | $11,196 |
Source: Public Records
Map
Nearby Homes
- 1125 S Chattanooga St
- 1103 Sisemore St
- 1122 S Chattanooga St
- 906 S Chattanooga St
- 805 Daugherty St
- 221 Chota Cir
- 705 Mclemore St
- 1152 Magnolia St
- 802 Mclemore St
- 800 Mclemore St
- 712 Mclemore St
- 707 Gilbert Ln
- 801 S Chattanooga St
- 908 Gilbert Ln
- 1002 Colerain St
- 506 Daugherty St
- 505 Daugherty St
- 100 Lake Terrace Dr
- 0 W Main St Unit 1518094
- 405 Magnolia St
- 207 Bomar St
- 1105 Magnolia St
- 1108 Daugherty St
- 1102 Magnolia St
- 1104 Magnolia St
- 1104 Daugherty St
- 1012 Magnolia St
- 1009 Magnolia St
- 1106 Magnolia St
- 414416 Daugherty St
- 414416 Daugherty St Unit 1
- 709 Spencer St
- 709 Spencer St Unit 5
- 806 Bomar St
- 1008 Magnolia St
- 703 Spencer St
- 807 Bomar St
- 1109 Daugherty St
- 1007 Magnolia St
- 804 Spencer St