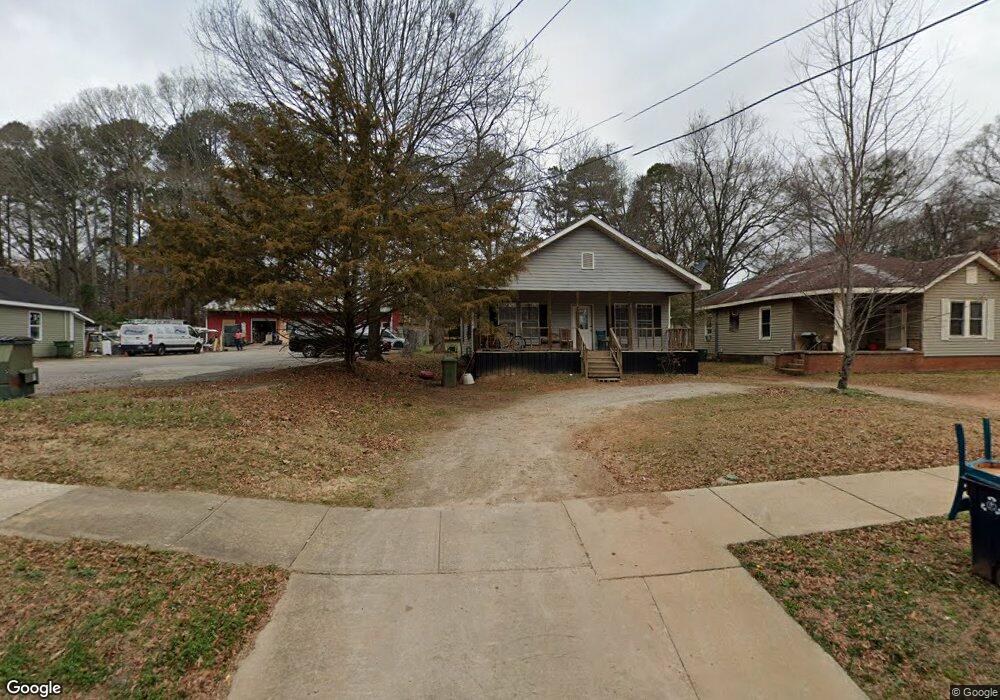
1101 Meriwether St Griffin, GA 30224
Spalding County NeighborhoodEstimated Value: $97,277 - $134,000
2
Beds
1
Bath
1,004
Sq Ft
$118/Sq Ft
Est. Value
About This Home
This home is located at 1101 Meriwether St, Griffin, GA 30224 and is currently estimated at $118,819, approximately $118 per square foot. 1101 Meriwether St is a home located in Spalding County with nearby schools including Anne Street Elementary School, Rehoboth Road Middle School, and Griffin High School.
Ownership History
Date
Name
Owned For
Owner Type
Purchase Details
Closed on
Nov 6, 2014
Sold by
Tarleton Janice R
Bought by
Jinks Properties Llc
Current Estimated Value
Purchase Details
Closed on
Nov 21, 2005
Sold by
Us Bank N
Bought by
Tarleton Avery
Purchase Details
Closed on
May 3, 2005
Sold by
Callaway Harry L and Callaway Reba L
Bought by
Firstar Bk
Purchase Details
Closed on
Mar 3, 1999
Sold by
Callaway Claudia C
Bought by
Callaway Harry L
Purchase Details
Closed on
Oct 6, 1992
Sold by
Nelson Lamar
Bought by
Callaway Harry L
Purchase Details
Closed on
Feb 9, 1988
Sold by
Fuller Marcus Stephen
Bought by
Nelson Lamar
Purchase Details
Closed on
Jul 30, 1985
Sold by
Fuller Marcus Stephen & Sand Ann Nelson
Bought by
Fuller Marcus Stephen
Purchase Details
Closed on
Jun 28, 1985
Sold by
Huckaby Mrs Marg F
Bought by
Fuller Marcus Stephen and Sandy Ann N
Purchase Details
Closed on
Apr 1, 1953
Bought by
Huckaby Mrs Marg F
Create a Home Valuation Report for This Property
The Home Valuation Report is an in-depth analysis detailing your home's value as well as a comparison with similar homes in the area
Home Values in the Area
Average Home Value in this Area
Purchase History
| Date | Buyer | Sale Price | Title Company |
|---|---|---|---|
| Jinks Properties Llc | $92,500 | -- | |
| Tarleton Avery | $16,000 | -- | |
| Firstar Bk | $34,875 | -- | |
| Callaway Harry L | -- | -- | |
| Callaway Harry L | $16,500 | -- | |
| Nelson Lamar | $27,500 | -- | |
| Fuller Marcus Stephen | -- | -- | |
| Fuller Marcus Stephen | $7,000 | -- | |
| Huckaby Mrs Marg F | -- | -- |
Source: Public Records
Tax History
| Year | Tax Paid | Tax Assessment Tax Assessment Total Assessment is a certain percentage of the fair market value that is determined by local assessors to be the total taxable value of land and additions on the property. | Land | Improvement |
|---|---|---|---|---|
| 2025 | $1,035 | $27,102 | $2,484 | $24,618 |
| 2024 | $1,012 | $27,102 | $2,484 | $24,618 |
| 2023 | $1,035 | $26,501 | $2,484 | $24,017 |
| 2022 | $906 | $22,676 | $2,070 | $20,606 |
| 2021 | $805 | $20,142 | $2,070 | $18,072 |
| 2020 | $625 | $15,648 | $2,070 | $13,578 |
| 2019 | $637 | $15,648 | $2,070 | $13,578 |
| 2018 | $604 | $14,303 | $2,070 | $12,233 |
| 2017 | $591 | $14,303 | $2,070 | $12,233 |
| 2016 | $601 | $14,303 | $2,070 | $12,233 |
| 2015 | $569 | $14,303 | $2,070 | $12,233 |
| 2014 | $629 | $14,303 | $2,070 | $12,233 |
Source: Public Records
Map
Nearby Homes
- 1022 Beck St
- 717 Scales St
- 731 Scales St
- 745 Scales St
- 1228-1328 Edgewood Ave
- 305 S 18th St
- 825 Pamela Dr
- 1320 N Cherokee Ave
- 915 W Poplar St
- 1440 W Poplar St
- 116 N 14th St
- 1025 W Broad St
- 402 Meriwether St
- 141 North Expy
- 711 W Broad St
- 1223 W Broad St
- 115 Kennelsman Dr Unit LOT FC 1
- 332 N 14th St
- 113 Alcovy Ct
- 312 Louise Ln Unit B
- 1025 Meriwether St
- 1105 Meriwether St Unit 12 & PT 11
- 1021 Meriwether St
- 1109 Meriwether St
- 1117 Meriwether St
- 1020 Meriwether St
- 1026 Meriwether St
- 1102 Meriwether St
- 1102 Meriwether St Unit 1104
- 1012 Meriwether St
- 1009 Meriwether St
- 1005 Meriwether St
- 1002 Meriwether St
- 1001 Meriwether St
- 1138 W College Extension
- 1142 W College Extension
- 926 Meriwether St
- 1042 W College Extension
- 925 Wilson Rd
- 925 Wilson Rd