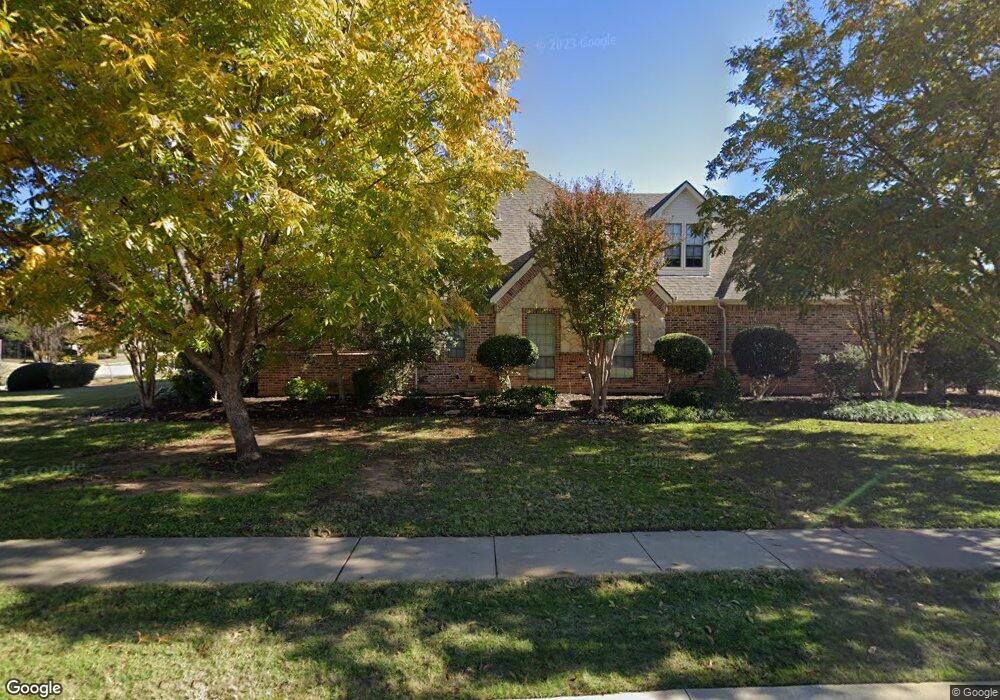
1101 Merlot Dr Southlake, TX 76092
Estimated Value: $1,408,000 - $1,717,000
4
Beds
4
Baths
4,438
Sq Ft
$352/Sq Ft
Est. Value
About This Home
This home is located at 1101 Merlot Dr, Southlake, TX 76092 and is currently estimated at $1,560,547, approximately $351 per square foot. 1101 Merlot Dr is a home located in Tarrant County with nearby schools including Old Union Elementary School, Eubanks Intermediate School, and George Dawson Middle School.
Ownership History
Date
Name
Owned For
Owner Type
Purchase Details
Closed on
Mar 30, 2001
Sold by
Randy Sullivan Custom Homes Inc
Bought by
White Thomas and White Carole
Current Estimated Value
Home Financials for this Owner
Home Financials are based on the most recent Mortgage that was taken out on this home.
Original Mortgage
$275,000
Outstanding Balance
$102,206
Interest Rate
7.13%
Estimated Equity
$1,458,341
Purchase Details
Closed on
Aug 1, 2000
Sold by
Versailles Iii Ltd
Bought by
Randy Sullivan Custom Homes Inc
Home Financials for this Owner
Home Financials are based on the most recent Mortgage that was taken out on this home.
Original Mortgage
$366,000
Interest Rate
8.15%
Create a Home Valuation Report for This Property
The Home Valuation Report is an in-depth analysis detailing your home's value as well as a comparison with similar homes in the area
Home Values in the Area
Average Home Value in this Area
Purchase History
| Date | Buyer | Sale Price | Title Company |
|---|---|---|---|
| White Thomas | -- | American Title Co | |
| Randy Sullivan Custom Homes Inc | -- | American Title Co |
Source: Public Records
Mortgage History
| Date | Status | Borrower | Loan Amount |
|---|---|---|---|
| Open | White Thomas | $275,000 | |
| Previous Owner | Randy Sullivan Custom Homes Inc | $366,000 |
Source: Public Records
Tax History Compared to Growth
Tax History
| Year | Tax Paid | Tax Assessment Tax Assessment Total Assessment is a certain percentage of the fair market value that is determined by local assessors to be the total taxable value of land and additions on the property. | Land | Improvement |
|---|---|---|---|---|
| 2025 | $10,246 | $1,523,557 | $377,550 | $1,146,007 |
| 2024 | $10,246 | $1,523,557 | $377,550 | $1,146,007 |
| 2023 | $16,480 | $1,623,000 | $377,550 | $1,245,450 |
| 2022 | $14,023 | $1,135,627 | $252,125 | $883,502 |
| 2021 | $17,037 | $851,721 | $252,125 | $599,596 |
| 2020 | $15,614 | $679,297 | $228,825 | $450,472 |
| 2019 | $19,649 | $859,859 | $150,000 | $709,859 |
| 2018 | $14,039 | $737,684 | $150,000 | $587,684 |
| 2017 | $17,782 | $717,398 | $150,000 | $567,398 |
| 2016 | $17,761 | $716,575 | $150,000 | $566,575 |
| 2015 | $13,974 | $702,630 | $90,000 | $612,630 |
| 2014 | $13,974 | $637,200 | $90,000 | $547,200 |
Source: Public Records
Map
Nearby Homes
- 1012 Cool River Dr
- 1100 La Paloma Ct
- 1304 Kings Brook Ct
- 702 Sussex Ct
- 1032 Rosavine Dr
- 1028 Rosavine Dr
- 1017 Rosavine Dr
- 1004 Rosavine Dr
- 1020 Rosavine Dr
- 1012 Rosavine Dr
- 1024 Rosavine Dr
- 1005 Rosavine Dr
- 1016 Rosavine Dr
- 1008 Rosavine Dr
- 223 Westwood Dr
- 708 Nettleton Dr
- 712 Ashleigh Ln
- 1401 Chardonnay Ct
- 710 Longford Dr
- 807 Cross Ln
- 1105 Merlot Dr
- 1013 Merlot Dr
- 1016 Merlot Dr
- 1100 Merlot Dr
- 1012 Merlot Dr
- 1109 Merlot Dr
- 1024 Merlot Dr
- 1104 Merlot Dr
- 1009 Merlot Dr
- 1020 Merlot Dr
- 1008 Merlot Dr
- 1117 Merlot Dr
- 1108 Merlot Dr
- 1113 Merlot Dr
- 1005 Merlot Dr
- 1121 Merlot Dr
- 1201 Forest Hills Dr
- 1004 Merlot Dr
- 1205 Forest Hills Dr
- 1112 Merlot Dr