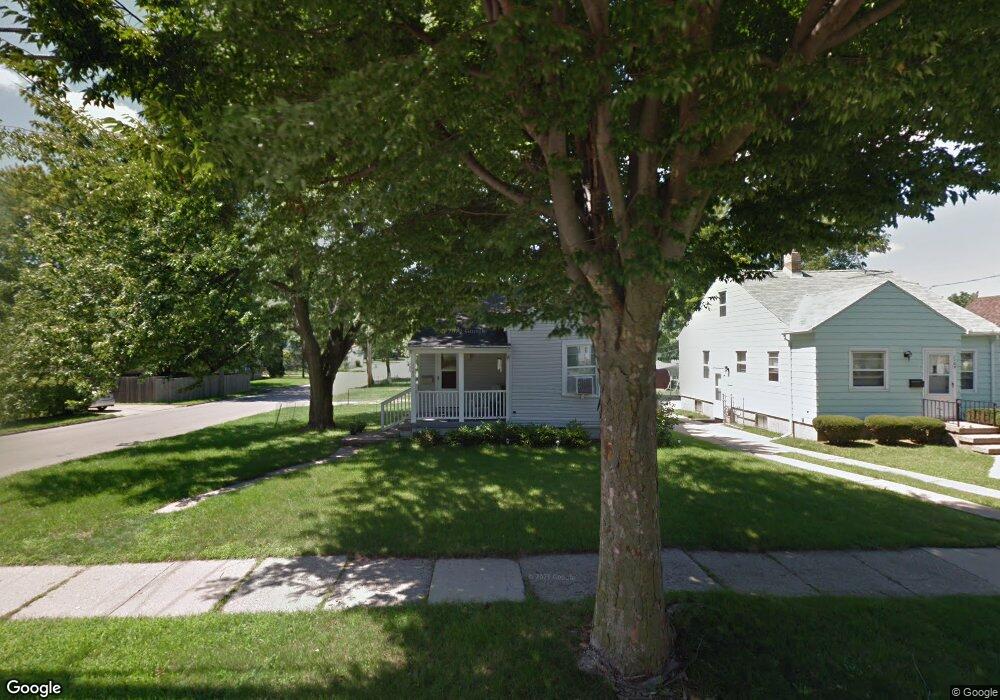
1101 N Jenison Ave Lansing, MI 48915
Hull Court Park NeighborhoodEstimated Value: $124,000 - $148,000
--
Bed
1
Bath
1,051
Sq Ft
$125/Sq Ft
Est. Value
About This Home
This home is located at 1101 N Jenison Ave, Lansing, MI 48915 and is currently estimated at $131,314, approximately $124 per square foot. 1101 N Jenison Ave is a home located in Ingham County with nearby schools including Willow School, Pattengill Academy, and J.W. Sexton High School.
Ownership History
Date
Name
Owned For
Owner Type
Purchase Details
Closed on
Apr 3, 2006
Sold by
Page Jennifer E and Page Eric W
Bought by
Sager Jordana A
Current Estimated Value
Home Financials for this Owner
Home Financials are based on the most recent Mortgage that was taken out on this home.
Original Mortgage
$108,792
Outstanding Balance
$62,447
Interest Rate
6.34%
Mortgage Type
FHA
Estimated Equity
$68,867
Purchase Details
Closed on
May 22, 2003
Sold by
Meginley Daniel and Meginley Kimberly
Bought by
Wejrowski Jennifer E and Page Eric W
Home Financials for this Owner
Home Financials are based on the most recent Mortgage that was taken out on this home.
Original Mortgage
$92,547
Interest Rate
5.71%
Mortgage Type
Purchase Money Mortgage
Purchase Details
Closed on
Jul 27, 2000
Sold by
Bf Partners Llc
Bought by
Meginley Daniel G and Meginley Kimberly K
Home Financials for this Owner
Home Financials are based on the most recent Mortgage that was taken out on this home.
Original Mortgage
$82,600
Interest Rate
8.19%
Mortgage Type
Purchase Money Mortgage
Purchase Details
Closed on
Mar 13, 2000
Sold by
Taxvest Ltd Partnership
Bought by
Bf Partners Llc
Create a Home Valuation Report for This Property
The Home Valuation Report is an in-depth analysis detailing your home's value as well as a comparison with similar homes in the area
Home Values in the Area
Average Home Value in this Area
Purchase History
| Date | Buyer | Sale Price | Title Company |
|---|---|---|---|
| Sager Jordana A | $110,500 | Talon Group | |
| Wejrowski Jennifer E | $94,000 | Transnation Title | |
| Meginley Daniel G | $83,300 | -- | |
| Bf Partners Llc | -- | -- |
Source: Public Records
Mortgage History
| Date | Status | Borrower | Loan Amount |
|---|---|---|---|
| Open | Sager Jordana A | $108,792 | |
| Previous Owner | Wejrowski Jennifer E | $92,547 | |
| Previous Owner | Meginley Daniel G | $82,600 |
Source: Public Records
Tax History Compared to Growth
Tax History
| Year | Tax Paid | Tax Assessment Tax Assessment Total Assessment is a certain percentage of the fair market value that is determined by local assessors to be the total taxable value of land and additions on the property. | Land | Improvement |
|---|---|---|---|---|
| 2025 | $2,444 | $60,300 | $5,700 | $54,600 |
| 2024 | $19 | $51,500 | $5,700 | $45,800 |
| 2023 | $2,293 | $46,300 | $5,700 | $40,600 |
| 2022 | $2,069 | $40,200 | $5,900 | $34,300 |
| 2021 | $2,026 | $38,400 | $5,400 | $33,000 |
| 2020 | $2,013 | $34,900 | $5,400 | $29,500 |
| 2019 | $1,929 | $33,200 | $5,400 | $27,800 |
| 2018 | $1,809 | $32,100 | $5,400 | $26,700 |
| 2017 | $1,731 | $32,100 | $5,400 | $26,700 |
| 2016 | $1,656 | $31,600 | $5,400 | $26,200 |
| 2015 | $1,656 | $30,000 | $10,783 | $19,217 |
| 2014 | $1,656 | $29,000 | $12,500 | $16,500 |
Source: Public Records
Map
Nearby Homes
- 1310 W Maple St
- 1300 W Maple St
- 1016 Cleo St
- 819 N Jenison Ave
- 1840 W Maple St
- 1224 Theodore St
- 751 Westmoreland Ave
- 1327 N Jenison Ave
- 1320 Glenrose Ave
- 821 N Verlinden Ave
- 910 Durant St
- 908 Clyde St
- 1338 Glenrose Ave
- 1129 N Martin Luther King jr Blvd
- 1145 N Martin Luther King Junior Blvd
- 914 Stanley St
- 1019 Daleford St
- 814 N Martin Luther King jr Blvd
- 1229 W Saginaw St
- 1225 W Saginaw St
- 1105 N Jenison Ave
- 1109 N Jenison Ave
- 1023 N Jenison Ave
- 1113 N Jenison Ave
- 1100 Hapeman St
- 1108 Hapeman St
- 1019 N Jenison Ave
- 1019 N Jeniso
- 1100 N Jeniso
- 1117 N Jenison Ave
- 1022 Hapeman St
- 1112 Hapeman St
- 1100 N Jenison Ave
- 1017 N Jenison Ave
- 1104 N Jenison Ave
- 1018 Hapeman St
- 1108 N Jenison Ave
- 1121 N Jenison Ave
- 1116 Hapeman St
- 1018 N Jenison Ave