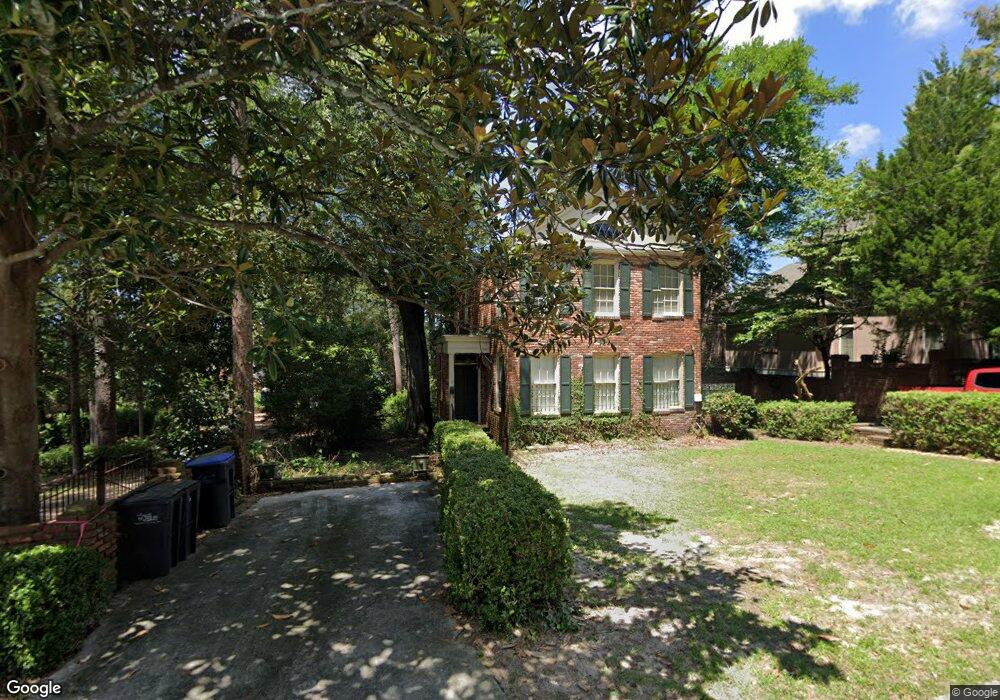
1101 Peachtree Rd Augusta, GA 30909
Forest Hills NeighborhoodEstimated Value: $175,000 - $231,684
3
Beds
2
Baths
1,620
Sq Ft
$129/Sq Ft
Est. Value
About This Home
This home is located at 1101 Peachtree Rd, Augusta, GA 30909 and is currently estimated at $208,421, approximately $128 per square foot. 1101 Peachtree Rd is a home located in Richmond County with nearby schools including R.B. Hunt Elementary School, Lake Forest Hills Elementary School, and Langford Middle School.
Ownership History
Date
Name
Owned For
Owner Type
Purchase Details
Closed on
Jun 30, 2023
Sold by
Sell M Brannon
Bought by
Shelton Michael C
Current Estimated Value
Create a Home Valuation Report for This Property
The Home Valuation Report is an in-depth analysis detailing your home's value as well as a comparison with similar homes in the area
Home Values in the Area
Average Home Value in this Area
Purchase History
| Date | Buyer | Sale Price | Title Company |
|---|---|---|---|
| Shelton Michael C | $180,000 | -- |
Source: Public Records
Tax History Compared to Growth
Tax History
| Year | Tax Paid | Tax Assessment Tax Assessment Total Assessment is a certain percentage of the fair market value that is determined by local assessors to be the total taxable value of land and additions on the property. | Land | Improvement |
|---|---|---|---|---|
| 2025 | $2,806 | $76,324 | $21,740 | $54,584 |
| 2024 | $2,806 | $63,348 | $21,740 | $41,608 |
| 2023 | $2,308 | $82,643 | $21,740 | $60,903 |
| 2022 | $2,316 | $60,489 | $21,740 | $38,749 |
| 2021 | $2,407 | $64,178 | $21,740 | $42,438 |
| 2020 | $2,156 | $51,174 | $13,221 | $37,953 |
| 2019 | $2,278 | $51,174 | $13,221 | $37,953 |
| 2018 | $2,294 | $51,174 | $13,221 | $37,953 |
| 2017 | $2,284 | $51,174 | $13,221 | $37,953 |
| 2016 | $2,285 | $51,174 | $13,221 | $37,953 |
| 2015 | $2,257 | $51,174 | $13,221 | $37,953 |
| 2014 | $2,455 | $51,174 | $13,221 | $37,953 |
Source: Public Records
Map
Nearby Homes
- 2875 Lake Forest Dr
- 3348 Walton Way
- 2904 Lombardy Ct
- 2923 Henry St
- 1117 Highland Ave
- 2812 Helen St
- 3011 Fox Spring Rd
- 3012 Walton Way
- 814 Windsor Ct
- 2818 Hazel St
- 2716 Hazel St
- 904 Highland Ave
- 1425 Glenn Ave
- 2602 Walton Way
- 3013 Cardinal Dr
- 1141 Arsenal Ave
- 600 Bransford Rd
- 542 Basin St
- 543 Basin St
- 2611 Hazel St
- 1007 Peachtree Rd
- 2804 Peachtree Place
- 1105 Peachtree Rd
- 2816 Hillcrest Ave
- 2803 Peachtree Place
- 1107 Peachtree Rd
- 2808 Peachtree Place
- 1130 Peachtree Rd
- 2814 Hillcrest Ave
- 2805 Peachtree Place
- 1111 Peachtree Rd
- 2810 Peachtree Place
- 1001 Peachtree Rd
- 0 Peachtree Place Unit 7365114
- 2814 Peachtree Place
- 2821 Hillcrest Ave
- 2821 Bellevue Ave
- 2816 Peachtree Place
- 2819 Bellevue Ave
- 2818 Peachtree Place