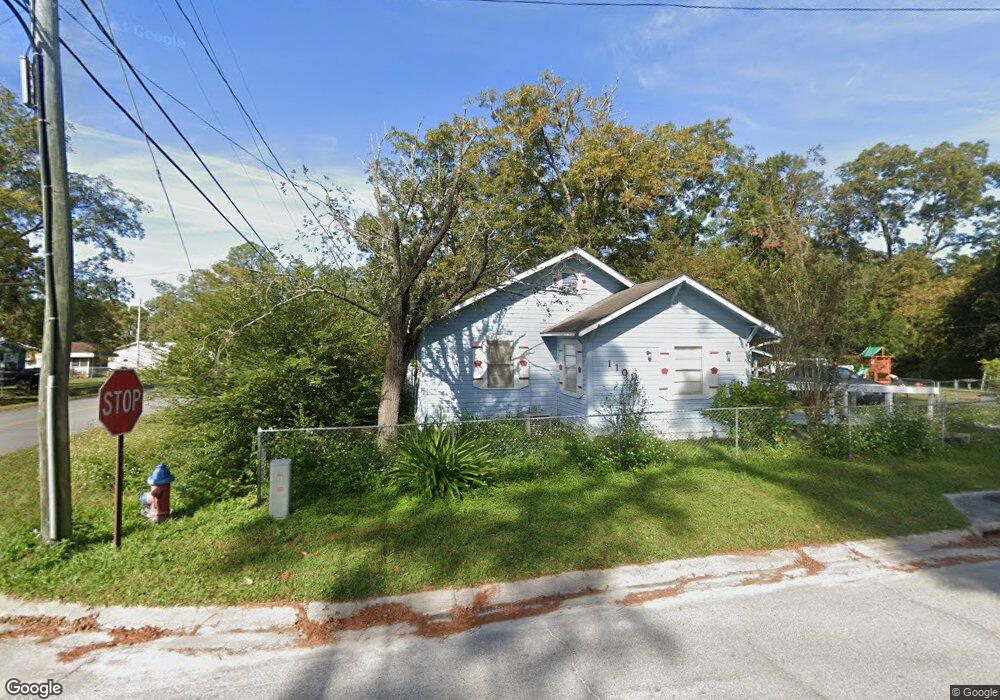
1101 Pollard St Waycross, GA 31503
Estimated Value: $69,000 - $95,000
2
Beds
1
Bath
1,178
Sq Ft
$70/Sq Ft
Est. Value
About This Home
This home is located at 1101 Pollard St, Waycross, GA 31503 and is currently estimated at $82,496, approximately $70 per square foot. 1101 Pollard St is a home located in Ware County with nearby schools including Wacona Elementary School, Ware County Middle School, and Ware County High School.
Ownership History
Date
Name
Owned For
Owner Type
Purchase Details
Closed on
Apr 30, 2021
Sold by
Barnard Terry F
Bought by
Leggett Katie Marie
Current Estimated Value
Home Financials for this Owner
Home Financials are based on the most recent Mortgage that was taken out on this home.
Original Mortgage
$48,127
Outstanding Balance
$43,615
Interest Rate
3.1%
Mortgage Type
FHA
Estimated Equity
$38,881
Purchase Details
Closed on
Mar 26, 2021
Sold by
Teston Dolores
Bought by
Barnard Terry F
Home Financials for this Owner
Home Financials are based on the most recent Mortgage that was taken out on this home.
Original Mortgage
$48,127
Outstanding Balance
$43,615
Interest Rate
3.1%
Mortgage Type
FHA
Estimated Equity
$38,881
Purchase Details
Closed on
Jul 3, 2007
Sold by
Barnard Terry Foster
Bought by
Teston Charles M and Teston Delores
Purchase Details
Closed on
Jun 27, 2007
Sold by
Barlow Winston
Bought by
Barlow Elizabeth S
Purchase Details
Closed on
Jan 1, 1994
Bought by
Barnard Terry
Create a Home Valuation Report for This Property
The Home Valuation Report is an in-depth analysis detailing your home's value as well as a comparison with similar homes in the area
Home Values in the Area
Average Home Value in this Area
Purchase History
| Date | Buyer | Sale Price | Title Company |
|---|---|---|---|
| Leggett Katie Marie | $50,000 | -- | |
| Barnard Terry F | -- | -- | |
| Teston Charles M | $19,796 | -- | |
| Barlow Elizabeth S | -- | -- | |
| Barnard Terry | $10,000 | -- |
Source: Public Records
Mortgage History
| Date | Status | Borrower | Loan Amount |
|---|---|---|---|
| Open | Leggett Katie Marie | $48,127 |
Source: Public Records
Tax History Compared to Growth
Tax History
| Year | Tax Paid | Tax Assessment Tax Assessment Total Assessment is a certain percentage of the fair market value that is determined by local assessors to be the total taxable value of land and additions on the property. | Land | Improvement |
|---|---|---|---|---|
| 2024 | $421 | $16,670 | $5,130 | $11,540 |
| 2023 | $429 | $17,886 | $2,462 | $15,424 |
| 2022 | $516 | $17,886 | $2,462 | $15,424 |
| 2021 | $373 | $11,900 | $2,462 | $9,438 |
| 2020 | $365 | $11,510 | $2,462 | $9,048 |
| 2019 | $360 | $11,120 | $2,462 | $8,658 |
| 2018 | $0 | $10,730 | $2,462 | $8,268 |
| 2017 | -- | $10,730 | $2,462 | $8,268 |
| 2016 | -- | $10,730 | $2,462 | $8,268 |
| 2015 | -- | $10,730 | $2,462 | $8,268 |
| 2014 | -- | $10,730 | $2,462 | $8,268 |
| 2013 | -- | $10,730 | $2,462 | $8,268 |
Source: Public Records
Map
Nearby Homes
- 1095 Pollard St
- 1105 Pollard St
- 1560 Hilliard Ave
- 1106 Pollard St
- 1633 Hilliard Ave
- 1655 Hilliard Ave
- 1557 Hilliard Ave
- 1671 Hilliard Ave
- 1113 Pollard St
- 1112 Colquitt St
- 1689 Hilliard Ave
- 1112 Pollard St
- 1502 Hilliard Ave
- 1128 Colquitt St
- 1062 Colquitt St
- 1115 Columbus St
- 1214 Pollard St
- 1215 Pollard St
- 1025 Columbus St
- 1133 Colquitt St