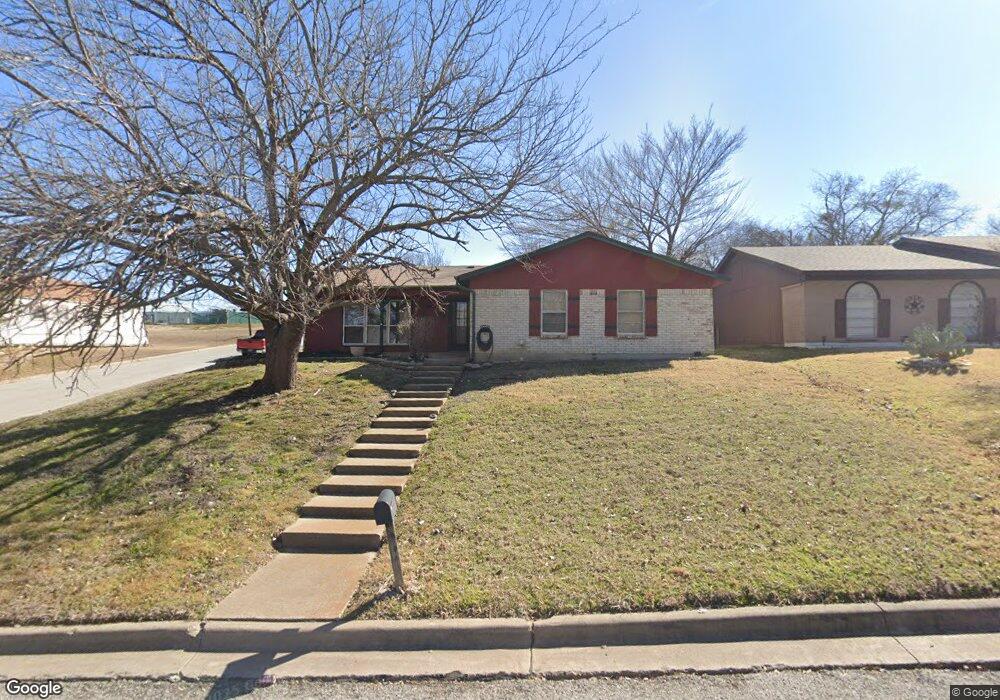
1101 Rumfield Rd Fort Worth, TX 76108
Estimated Value: $253,735 - $277,000
3
Beds
2
Baths
1,653
Sq Ft
$158/Sq Ft
Est. Value
About This Home
This home is located at 1101 Rumfield Rd, Fort Worth, TX 76108 and is currently estimated at $261,434, approximately $158 per square foot. 1101 Rumfield Rd is a home located in Tarrant County with nearby schools including Liberty Elementary School, Brewer Middle School, and Tannahill Intermediate School.
Ownership History
Date
Name
Owned For
Owner Type
Purchase Details
Closed on
May 27, 1997
Sold by
Mejia Steven Fredrick and Mejia Stacy Renee
Bought by
Harmon Troy and Harmon Lanessa
Current Estimated Value
Home Financials for this Owner
Home Financials are based on the most recent Mortgage that was taken out on this home.
Original Mortgage
$50,204
Outstanding Balance
$7,259
Interest Rate
8.1%
Mortgage Type
FHA
Estimated Equity
$254,175
Purchase Details
Closed on
Dec 30, 1993
Sold by
United States Of America
Bought by
Mejia Steven Fredrick and Mejia Stacy Renee
Home Financials for this Owner
Home Financials are based on the most recent Mortgage that was taken out on this home.
Original Mortgage
$40,788
Interest Rate
7.12%
Mortgage Type
FHA
Purchase Details
Closed on
Sep 7, 1993
Sold by
Kelly James C and Griner Kelly Katrina T
Bought by
United States Of America
Create a Home Valuation Report for This Property
The Home Valuation Report is an in-depth analysis detailing your home's value as well as a comparison with similar homes in the area
Home Values in the Area
Average Home Value in this Area
Purchase History
| Date | Buyer | Sale Price | Title Company |
|---|---|---|---|
| Harmon Troy | -- | Fidelity National Title | |
| Mejia Steven Fredrick | -- | Trinity Western Title Co | |
| United States Of America | -- | -- |
Source: Public Records
Mortgage History
| Date | Status | Borrower | Loan Amount |
|---|---|---|---|
| Open | Harmon Troy | $50,204 | |
| Previous Owner | Mejia Steven Fredrick | $40,788 |
Source: Public Records
Tax History Compared to Growth
Tax History
| Year | Tax Paid | Tax Assessment Tax Assessment Total Assessment is a certain percentage of the fair market value that is determined by local assessors to be the total taxable value of land and additions on the property. | Land | Improvement |
|---|---|---|---|---|
| 2025 | $3,303 | $256,712 | $49,810 | $206,902 |
| 2024 | $3,303 | $256,712 | $49,810 | $206,902 |
| 2023 | $4,521 | $258,511 | $49,810 | $208,701 |
| 2022 | $4,681 | $187,412 | $25,000 | $162,412 |
| 2021 | $4,322 | $174,743 | $25,000 | $149,743 |
| 2020 | $3,958 | $156,874 | $25,000 | $131,874 |
| 2019 | $3,736 | $157,982 | $25,000 | $132,982 |
| 2018 | $2,836 | $118,060 | $12,000 | $106,060 |
| 2017 | $3,136 | $118,002 | $12,000 | $106,002 |
| 2016 | $2,851 | $114,359 | $12,000 | $102,359 |
| 2015 | $2,194 | $88,700 | $10,000 | $78,700 |
| 2014 | $2,194 | $88,700 | $10,000 | $78,700 |
Source: Public Records
Map
Nearby Homes
- 1105 Rumfield Rd
- 909 Rumfield Rd
- 915 Rumfield Rd
- 1100 Rumfield Rd
- 1109 Rumfield Rd
- 8233 Albert St
- 916 Rumfield Rd
- 8232 Richard St
- 8229 Albert St
- 1104 Rumfield Rd
- 8228 Richard St
- 1108 Rumfield Rd
- 8224 Richard St
- 8221 Albert St
- 1201 Rumfield Rd
- 912 Rumfield Rd
- 8220 Richard St
- 1116 Rumfield Rd
- 8217 Albert St
- 910 Rumfield Rd