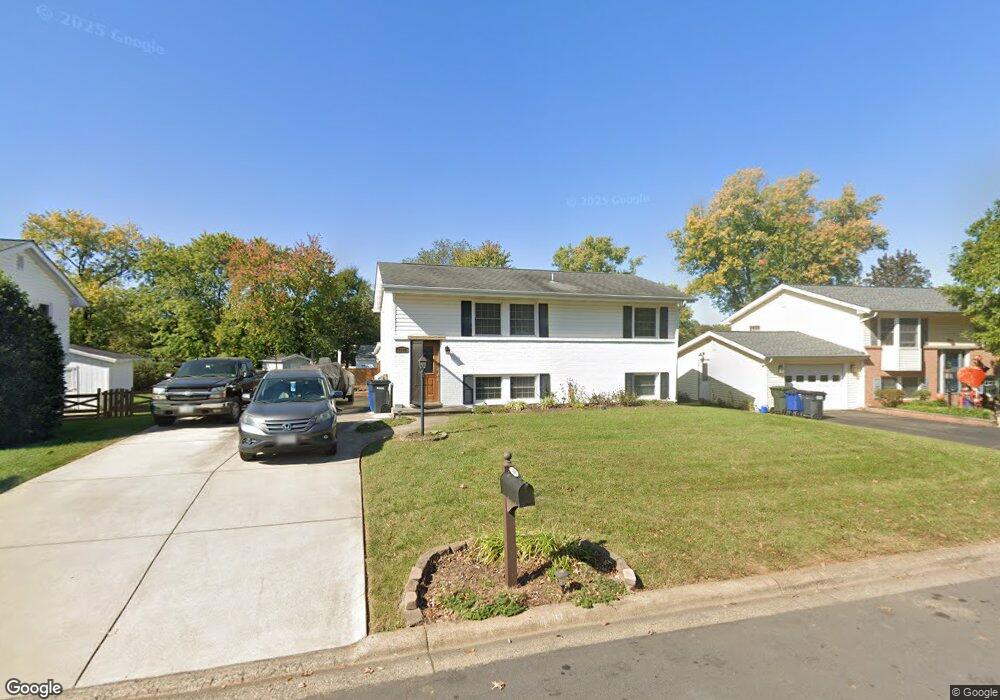
1101 S Culpeper Rd Sterling, VA 20164
Estimated Value: $563,193 - $642,000
4
Beds
3
Baths
1,077
Sq Ft
$566/Sq Ft
Est. Value
About This Home
This home is located at 1101 S Culpeper Rd, Sterling, VA 20164 and is currently estimated at $609,548, approximately $565 per square foot. 1101 S Culpeper Rd is a home located in Loudoun County with nearby schools including Forest Grove Elementary School, Sterling Middle School, and Park View High School.
Ownership History
Date
Name
Owned For
Owner Type
Purchase Details
Closed on
Mar 30, 2021
Sold by
Thomasson Stephen M
Bought by
Thomasson Stephen M
Current Estimated Value
Purchase Details
Closed on
Mar 26, 2021
Sold by
Thomasson Stephen M and Thomasson Jennifer B
Bought by
Thomasson Stephen M
Purchase Details
Closed on
Sep 2, 2020
Sold by
Thomasson Stephen M
Bought by
Thomasson Stephen M and The Stephen M Thomasson Legacy
Purchase Details
Closed on
Jun 6, 2019
Sold by
Thomasson Stephen M and Thomasson Nan K
Bought by
Thomasson Stephen M
Purchase Details
Closed on
May 27, 1994
Sold by
Scordellis
Bought by
Jordan Brian M
Home Financials for this Owner
Home Financials are based on the most recent Mortgage that was taken out on this home.
Original Mortgage
$123,600
Interest Rate
8.22%
Create a Home Valuation Report for This Property
The Home Valuation Report is an in-depth analysis detailing your home's value as well as a comparison with similar homes in the area
Home Values in the Area
Average Home Value in this Area
Purchase History
| Date | Buyer | Sale Price | Title Company |
|---|---|---|---|
| Thomasson Stephen M | -- | None Listed On Document | |
| Thomasson Stephen M | -- | None Available | |
| Thomasson Stephen M | -- | None Available | |
| Thomasson Stephen M | -- | None Available | |
| Jordan Brian M | $154,500 | -- |
Source: Public Records
Mortgage History
| Date | Status | Borrower | Loan Amount |
|---|---|---|---|
| Previous Owner | Jordan Brian M | $123,600 |
Source: Public Records
Tax History Compared to Growth
Tax History
| Year | Tax Paid | Tax Assessment Tax Assessment Total Assessment is a certain percentage of the fair market value that is determined by local assessors to be the total taxable value of land and additions on the property. | Land | Improvement |
|---|---|---|---|---|
| 2025 | $4,715 | $585,750 | $234,400 | $351,350 |
| 2024 | $4,627 | $534,920 | $209,400 | $325,520 |
| 2023 | $4,397 | $502,480 | $209,400 | $293,080 |
| 2022 | $4,247 | $477,150 | $189,400 | $287,750 |
| 2021 | $4,198 | $428,410 | $179,400 | $249,010 |
| 2020 | $4,058 | $392,090 | $154,400 | $237,690 |
| 2019 | $3,953 | $378,290 | $154,400 | $223,890 |
| 2018 | $3,733 | $344,040 | $139,400 | $204,640 |
| 2017 | $3,706 | $329,460 | $139,400 | $190,060 |
| 2016 | $3,580 | $312,640 | $0 | $0 |
| 2015 | $3,237 | $164,320 | $0 | $164,320 |
| 2014 | $3,192 | $155,490 | $0 | $155,490 |
Source: Public Records
Map
Nearby Homes
- 1002 S Buckingham Rd
- 314 E Staunton Ave
- 309 Williamsburg Rd
- 400 E Poplar Rd
- 1114 S Dickenson Ave
- 801 S Concord Ct
- 100 W Poplar Rd
- 1050 Ramsgate Ct Unit C
- 104 Silverleaf Ct
- 1072 Norwood Ct
- 22855 Chestnut Oak Terrace
- 706 S Dogwood Ct
- 920 Windsor Ct
- 346 Lancaster Square
- 1106 E Maple Ave
- 1049A Margate Ct
- 1030 Salisbury Ct
- 1034 Salisbury Ct
- 19 Butternut Way
- 229 Applegate Dr
- 1103 S Culpeper Rd
- 1011 S Culpeper Rd
- 1100 S Buckingham Rd
- 1010 S Buckingham Rd
- 1105 S Culpeper Rd
- 1102 S Buckingham Rd
- 1009 S Culpeper Rd
- 1008 S Buckingham Rd
- 1100 S Culpeper Rd
- 1008 S Culpeper Rd
- 1102 S Culpeper Rd
- 1104 S Buckingham Rd
- 1107 S Culpeper Rd
- 1007 S Culpeper Rd
- 1006 S Buckingham Rd
- 1006 S Culpeper Rd
- 1104 S Culpeper Rd
- 403 Williamsburg Rd
- 405 Williamsburg Rd
- 401 Williamsburg Rd