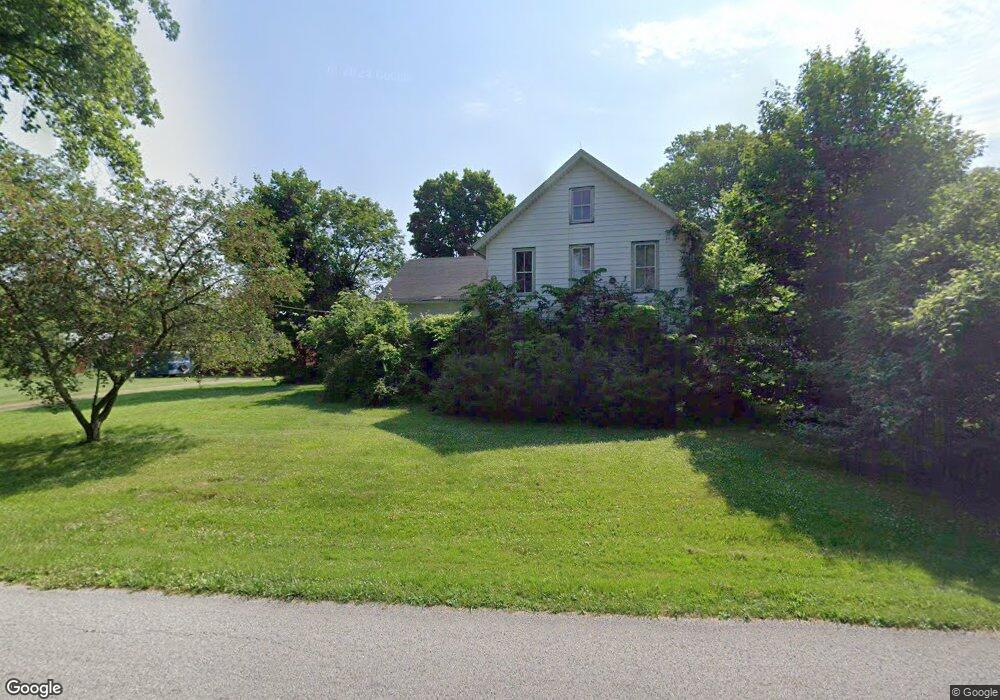
1101 S Wozniak Rd La Porte, IN 46350
Estimated Value: $274,000 - $530,000
4
Beds
2
Baths
2,565
Sq Ft
$148/Sq Ft
Est. Value
About This Home
This home is located at 1101 S Wozniak Rd, La Porte, IN 46350 and is currently estimated at $379,452, approximately $147 per square foot. 1101 S Wozniak Rd is a home located in LaPorte County with nearby schools including Westville Elementary School and Westville High School.
Ownership History
Date
Name
Owned For
Owner Type
Purchase Details
Closed on
Jan 28, 2022
Sold by
Todd Gore Homes Llc
Bought by
Lancaster Evan and Lancaster Michelle L
Current Estimated Value
Home Financials for this Owner
Home Financials are based on the most recent Mortgage that was taken out on this home.
Original Mortgage
$412,464
Outstanding Balance
$383,050
Interest Rate
3.56%
Mortgage Type
New Conventional
Estimated Equity
-$3,598
Purchase Details
Closed on
Mar 17, 2021
Sold by
Millers Angus Hills Llc
Bought by
Lancaster Evan M and Lancaster Michelle L
Purchase Details
Closed on
Sep 26, 2012
Sold by
Millers Angus Hills Llc
Bought by
1103 House Llc
Purchase Details
Closed on
Dec 19, 2006
Sold by
Miller David R and Mckibben Carrie A
Bought by
Millers Angus Hills Llc
Purchase Details
Closed on
May 5, 2004
Sold by
Miller Helen M
Bought by
Miller David R and Mckibben Carrie A
Create a Home Valuation Report for This Property
The Home Valuation Report is an in-depth analysis detailing your home's value as well as a comparison with similar homes in the area
Home Values in the Area
Average Home Value in this Area
Purchase History
| Date | Buyer | Sale Price | Title Company |
|---|---|---|---|
| Lancaster Evan | -- | None Listed On Document | |
| Lancaster Evan M | -- | None Available | |
| 1103 House Llc | -- | None Available | |
| Millers Angus Hills Llc | -- | None Available | |
| Miller David R | -- | None Available |
Source: Public Records
Mortgage History
| Date | Status | Borrower | Loan Amount |
|---|---|---|---|
| Open | Lancaster Evan | $412,464 |
Source: Public Records
Tax History Compared to Growth
Tax History
| Year | Tax Paid | Tax Assessment Tax Assessment Total Assessment is a certain percentage of the fair market value that is determined by local assessors to be the total taxable value of land and additions on the property. | Land | Improvement |
|---|---|---|---|---|
| 2024 | $2,529 | $163,000 | $47,200 | $115,800 |
| 2022 | $2,468 | $133,700 | $42,100 | $91,600 |
| 2021 | $2,557 | $127,700 | $43,100 | $84,600 |
| 2020 | $2,417 | $127,700 | $43,100 | $84,600 |
| 2019 | $2,488 | $131,200 | $45,400 | $85,800 |
| 2018 | $2,617 | $130,300 | $45,800 | $84,500 |
| 2017 | $2,433 | $120,800 | $41,400 | $79,400 |
| 2016 | $2,595 | $127,200 | $42,400 | $84,800 |
| 2014 | $3,267 | $182,500 | $43,200 | $139,300 |
Source: Public Records
Map
Nearby Homes
- 906 N Honeysuckle Ln
- 0 N Goldring Rd Unit NRA828377
- 3555 S Maple Lane Ct
- 0 N Forrester Rd
- 6475 W Joliet Rd
- 0 W Applewood Dr Unit NRA813098
- 7101 W 125 N
- 1139 S 500 W
- 1111 S 500 W
- 7725 W Arndt Ct
- 1441 N Wozniak Rd
- Lot 17 S Rolling Meadows Dr
- Lot 18 S Rolling Meadows Dr
- 277 U S 421
- 1824 Creekside Ct
- 10222 W Rolling Meadows Dr
- 1796 S Rolling Meadows Dr
- 1927 N Country Ln
- 5709 W 150 N
- 1941 N Shebel Rd
- 1101 S Wozniak Rd
- 1103 S Wozniak Rd
- 1201 S Wozniak Rd
- 1038 S Wozniak Rd
- 1202 S Wozniak Rd
- 7495 W 100 S
- 7455 W 100 S
- 1272 S Wozniak Rd
- 1302 S Wozniak Rd
- 955 S Wozniak Rd
- 100 South Ave
- 1325 S Wozniak Rd
- 1377 S Wozniak Rd
- 7295 W 100 S
- 1422 S Wozniak Rd
- 7255 W 100 S
- 822 S Wozniak Rd
- 792 S Wozniak Rd
- 1474 S Wozniak Rd
- 7747 W 125 S