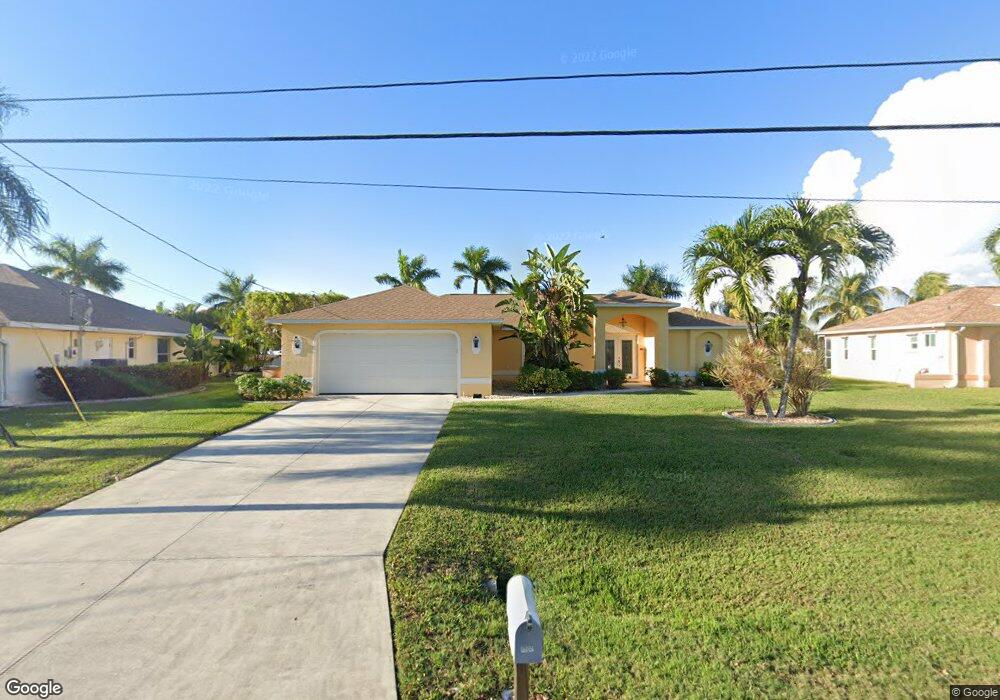
1101 SE 13th St Cape Coral, FL 33990
Hancock NeighborhoodEstimated Value: $429,000 - $581,000
3
Beds
2
Baths
2,679
Sq Ft
$189/Sq Ft
Est. Value
About This Home
This home is located at 1101 SE 13th St, Cape Coral, FL 33990 and is currently estimated at $506,965, approximately $189 per square foot. 1101 SE 13th St is a home located in Lee County with nearby schools including Caloosa Elementary School, Tropic Isles Elementary School, and Hancock Creek Elementary School.
Ownership History
Date
Name
Owned For
Owner Type
Purchase Details
Closed on
Jul 28, 2023
Sold by
Smyth Robert B
Bought by
Smyth Robert B
Current Estimated Value
Purchase Details
Closed on
Jan 8, 2004
Sold by
Campbell Theodore D
Bought by
Smyth Robert B and Smyth Margaret M
Home Financials for this Owner
Home Financials are based on the most recent Mortgage that was taken out on this home.
Original Mortgage
$195,900
Interest Rate
5.87%
Purchase Details
Closed on
Jun 19, 2001
Sold by
Alliance Assets L L C
Bought by
Mckim David and Mckim Judith L
Home Financials for this Owner
Home Financials are based on the most recent Mortgage that was taken out on this home.
Original Mortgage
$108,146
Interest Rate
7.14%
Purchase Details
Closed on
Dec 15, 2000
Sold by
Rabczewski Gleb and Rabczewski Ellen
Bought by
Alliance Assets L L C
Create a Home Valuation Report for This Property
The Home Valuation Report is an in-depth analysis detailing your home's value as well as a comparison with similar homes in the area
Home Values in the Area
Average Home Value in this Area
Purchase History
| Date | Buyer | Sale Price | Title Company |
|---|---|---|---|
| Smyth Robert B | $100 | None Listed On Document | |
| Smyth Robert B | $244,900 | -- | |
| Mckim David | $25,800 | -- | |
| Alliance Assets L L C | $25,000 | -- |
Source: Public Records
Mortgage History
| Date | Status | Borrower | Loan Amount |
|---|---|---|---|
| Previous Owner | Smyth Robert B | $195,900 | |
| Previous Owner | Mckim David | $108,146 |
Source: Public Records
Tax History Compared to Growth
Tax History
| Year | Tax Paid | Tax Assessment Tax Assessment Total Assessment is a certain percentage of the fair market value that is determined by local assessors to be the total taxable value of land and additions on the property. | Land | Improvement |
|---|---|---|---|---|
| 2025 | $3,928 | $244,613 | -- | -- |
| 2024 | $3,852 | $237,719 | -- | -- |
| 2023 | $3,852 | $230,795 | $0 | $0 |
| 2022 | $3,604 | $224,073 | $0 | $0 |
| 2021 | $3,683 | $352,203 | $103,290 | $248,913 |
| 2020 | $3,733 | $214,543 | $0 | $0 |
| 2019 | $3,620 | $209,719 | $0 | $0 |
| 2018 | $3,610 | $205,809 | $0 | $0 |
| 2017 | $3,592 | $201,576 | $0 | $0 |
| 2016 | $3,516 | $276,826 | $78,356 | $198,470 |
| 2015 | $3,546 | $254,699 | $74,660 | $180,039 |
| 2014 | $3,551 | $240,198 | $72,947 | $167,251 |
| 2013 | -- | $241,299 | $75,363 | $165,936 |
Source: Public Records
Map
Nearby Homes
- 222 SE 10th Ave
- 1939 SE 10th Ave
- 1001 SE 12th Ln
- 1039 SE 10th St
- 1234 SE 13th Ave
- 1416 SE 11th Place
- 1024 SE 14th Terrace
- 904 SE 13th St Unit 201
- 1138 SE 9th Ct
- 911 SE 13th Terrace
- 1109 Country Club Blvd
- 1222 SE 8th Place
- 1207 SE 8th Place
- 1302, 1216, 1222 SE 8th Place
- 1403 SE 8th Place
- 1216 SE 13th Ave
- 307 SE 13th St
- 1903 SE 13th Terrace
- 1518 SE 11th Ave
- 919 SE 16th St
- 1105 SE 13th St
- 1302 SE 10th Place
- 1109 SE 13th St
- 1102 SE 13th St
- 1308 SE 10th Place Unit 22
- 1301 SE 10th Place
- 1110 SE 13th St
- 1123 SE 12th Ln
- 1125/1127 SE 12th Ln
- 1205 SE 10th Ave Unit A-C
- 1312 SE 10th Place
- 1116 SE 13th St
- 1613 SE 10th Ave
- 1127 SE 12th Ln
- 1125 SE 12th Ln
- 1117 SE 13th St
- 1109 SE 12th Ln
- 1211 SE 10th Ave
- 1317 SE 10th Place