1101 Summerwind Dr Greensboro, GA 30642
Estimated Value: $1,742,000 - $1,987,000
--
Bed
3
Baths
2,543
Sq Ft
$732/Sq Ft
Est. Value
About This Home
This home is located at 1101 Summerwind Dr, Greensboro, GA 30642 and is currently estimated at $1,861,084, approximately $731 per square foot. 1101 Summerwind Dr is a home located in Greene County with nearby schools including Greene County High School.
Ownership History
Date
Name
Owned For
Owner Type
Purchase Details
Closed on
Jun 5, 2009
Sold by
Mosley John E
Bought by
Mosley Joh E and Mosley Jody S
Current Estimated Value
Home Financials for this Owner
Home Financials are based on the most recent Mortgage that was taken out on this home.
Original Mortgage
$276,000
Outstanding Balance
$174,663
Interest Rate
4.8%
Mortgage Type
New Conventional
Estimated Equity
$1,686,421
Purchase Details
Closed on
Nov 14, 2002
Sold by
Mosley John E
Bought by
Mosley John E
Purchase Details
Closed on
Feb 20, 1998
Sold by
Mosley John E and Mosley Siebert A
Bought by
Mosley John E
Purchase Details
Closed on
Aug 13, 1996
Sold by
Mosley John E
Bought by
Mosley John E and Mosley Siebert A
Purchase Details
Closed on
Aug 12, 1996
Sold by
Mosley John E and Mosley Siebert J
Bought by
Mosley John E
Purchase Details
Closed on
Jul 12, 1995
Sold by
North Shosre Partners L P
Bought by
Mosley John E and Mosley Siebert J
Create a Home Valuation Report for This Property
The Home Valuation Report is an in-depth analysis detailing your home's value as well as a comparison with similar homes in the area
Home Values in the Area
Average Home Value in this Area
Purchase History
| Date | Buyer | Sale Price | Title Company |
|---|---|---|---|
| Mosley Joh E | -- | -- | |
| Mosley John E | -- | -- | |
| Mosley John E | -- | -- | |
| Mosley John E | -- | -- | |
| Mosley John E | -- | -- | |
| Mosley John E | $83,000 | -- |
Source: Public Records
Mortgage History
| Date | Status | Borrower | Loan Amount |
|---|---|---|---|
| Open | Mosley Joh E | $276,000 |
Source: Public Records
Tax History Compared to Growth
Tax History
| Year | Tax Paid | Tax Assessment Tax Assessment Total Assessment is a certain percentage of the fair market value that is determined by local assessors to be the total taxable value of land and additions on the property. | Land | Improvement |
|---|---|---|---|---|
| 2024 | $8,229 | $714,820 | $390,000 | $324,820 |
| 2023 | $7,952 | $711,264 | $390,000 | $321,264 |
| 2022 | $8,581 | $472,160 | $257,240 | $214,920 |
| 2021 | $8,616 | $444,880 | $257,240 | $187,640 |
| 2020 | $7,638 | $355,920 | $234,000 | $121,920 |
| 2019 | $7,755 | $355,920 | $234,000 | $121,920 |
| 2018 | $7,733 | $355,920 | $234,000 | $121,920 |
| 2017 | $7,233 | $354,266 | $234,000 | $120,266 |
| 2016 | $7,279 | $356,442 | $234,000 | $122,442 |
| 2015 | $7,165 | $356,441 | $234,000 | $122,442 |
| 2014 | $7,156 | $346,801 | $234,000 | $112,801 |
Source: Public Records
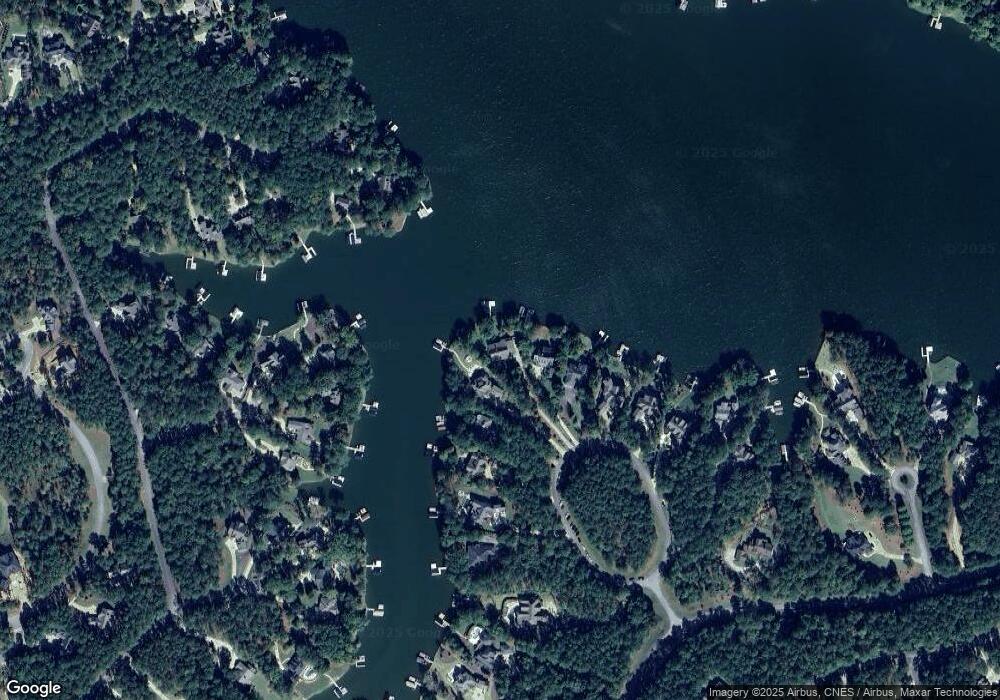
Map
Nearby Homes
- 1041 Kings Bridge Rd
- 1201 Swift Creek
- 2340 Club Drive Cir
- 1110 Broadpoint Dr
- 1051 Swift Creek
- 1321 Swift Creek
- 1140 Fox Bend
- 1051 Armors Ford
- 1071 Brookside
- 1071 Palmers View
- 1050 Tailwater Unit A
- 1050 Tailwater
- 1011 Tuggle Creek
- 1101 Palmers View
- 1030 Tailwater
- 1080 Tailwater
- 1021 Reynolds Pkwy
- 1010 Creekside Unit A
- 1010 Creekside
- 1020 Homestead
- 1111 Summerwind Dr
- 1091 Summerwind Dr
- 1121 Summerwind Dr
- 1081 Summerwind Dr
- 1131 Summerwind Dr
- 1071 Summerwind Dr
- 1061 Summerwind Dr
- 1141 Summerwind Dr
- 1051 Lance Way Bay
- 0 Summerwind Dr Unit 8614378
- 0 Summerwind Dr Unit 8142351
- 0 Summerwind Dr Unit 7618253
- 0 Summerwind Dr Unit 8670870
- 0 Summerwind Dr Unit 8453533
- 0 Summerwind Dr Unit 8311297
- 0 Summerwind Dr Unit 8301015
- 0 Summerwind Dr Unit 7477536
- 0 Summerwind Dr Unit 7292225
- 0 Summerwind Dr Unit 3127566
- 0 Summerwind Dr Unit 3184699