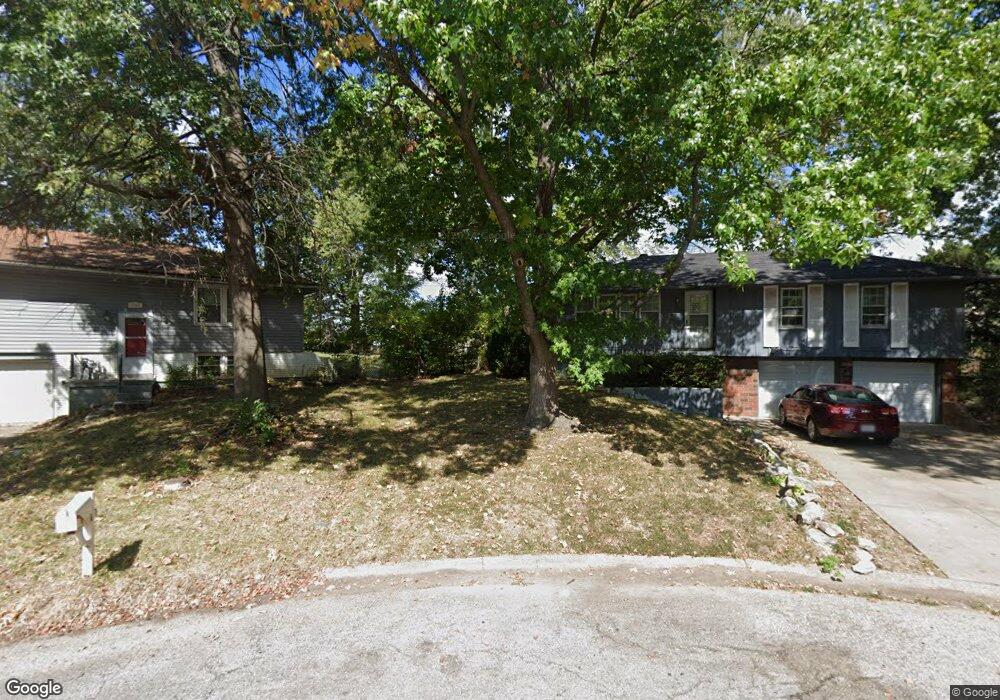
1101 SW Earls Ct Blue Springs, MO 64014
Estimated Value: $211,000 - $260,000
3
Beds
2
Baths
1,104
Sq Ft
$213/Sq Ft
Est. Value
About This Home
This home is located at 1101 SW Earls Ct, Blue Springs, MO 64014 and is currently estimated at $235,699, approximately $213 per square foot. 1101 SW Earls Ct is a home located in Jackson County with nearby schools including William Bryant Elementary School, Moreland Ridge Middle School, and Blue Springs South High School.
Ownership History
Date
Name
Owned For
Owner Type
Purchase Details
Closed on
Jan 1, 2005
Sold by
Burns Deanna A and Burns Jeffrey A
Bought by
Burns Realty Llc
Current Estimated Value
Purchase Details
Closed on
Oct 26, 2000
Sold by
Hall Jacob A and Hall Janice R
Bought by
Burns Jeffrey A and Burns Deanna A
Home Financials for this Owner
Home Financials are based on the most recent Mortgage that was taken out on this home.
Original Mortgage
$68,000
Interest Rate
7.89%
Mortgage Type
Purchase Money Mortgage
Purchase Details
Closed on
Jul 15, 1997
Sold by
Bailey Stephen C and Bailey Kathryn
Bought by
Hall Jacob A and Hall Janice R
Home Financials for this Owner
Home Financials are based on the most recent Mortgage that was taken out on this home.
Original Mortgage
$72,950
Interest Rate
7.94%
Mortgage Type
FHA
Create a Home Valuation Report for This Property
The Home Valuation Report is an in-depth analysis detailing your home's value as well as a comparison with similar homes in the area
Home Values in the Area
Average Home Value in this Area
Purchase History
| Date | Buyer | Sale Price | Title Company |
|---|---|---|---|
| Burns Realty Llc | -- | Commercial | |
| Burns Jeffrey A | -- | Security Land Title Company | |
| Hall Jacob A | -- | Old Republic Title Co |
Source: Public Records
Mortgage History
| Date | Status | Borrower | Loan Amount |
|---|---|---|---|
| Previous Owner | Burns Jeffrey A | $68,000 | |
| Previous Owner | Hall Jacob A | $72,950 |
Source: Public Records
Tax History Compared to Growth
Tax History
| Year | Tax Paid | Tax Assessment Tax Assessment Total Assessment is a certain percentage of the fair market value that is determined by local assessors to be the total taxable value of land and additions on the property. | Land | Improvement |
|---|---|---|---|---|
| 2025 | $1,938 | $24,373 | $6,483 | $17,890 |
| 2024 | $1,900 | $23,750 | $5,620 | $18,130 |
| 2023 | $1,900 | $23,750 | $5,620 | $18,130 |
| 2022 | $1,669 | $18,430 | $5,178 | $13,252 |
| 2021 | $1,667 | $18,430 | $5,178 | $13,252 |
| 2020 | $1,554 | $17,481 | $5,178 | $12,303 |
| 2019 | $1,593 | $18,528 | $5,178 | $13,350 |
| 2018 | $1,555 | $17,413 | $2,886 | $14,527 |
| 2017 | $1,512 | $17,413 | $2,886 | $14,527 |
| 2016 | $1,512 | $16,977 | $2,875 | $14,102 |
| 2014 | $1,488 | $16,644 | $2,818 | $13,826 |
Source: Public Records
Map
Nearby Homes
- 1305 S Ward Pkwy
- 105 SW Windsor Ct
- 1005 SE Alice St
- 4805 SW 6th St
- 4809 SW 6th St
- 1901 SW Gladstone Dr
- 1616 SE 1st Street Terrace
- 1628 SE 1st Street Terrace
- 1820 SW Keystone Dr
- 1004 SW Twilight Ln
- 1410 SW 11th St
- 1301 SW Sunrise Dr
- 1201 SW Hopi St
- 204 SE Cromwell St
- 1331 SW Horizon Dr
- 116 SW Chicago St
- 1917 SE Abbey St
- 514 SW 10th St
- 1300 SE Piccadilly St
- 2115 S 7 Hwy
- 1105 SW Earls Ct
- 1100 SW Earls Ct
- 501 SW Victor Dr
- 1104 SW Earls Ct
- 505 SW Victor Dr
- 409 SW Victor Dr
- 1100 SW Westminister Rd
- 509 SW Victor Dr
- 1104 SW Westminister Rd
- 405 SW Victor Dr
- 1037 SW Kingscross Rd
- 513 SW Victor Dr
- 1039 SW Kingscross Rd
- 401 SW Victor Dr
- 1033 SW Kingscross Rd
- 408 SW Victor Dr
- 504 SW Victor Dr
- 508 SW Victor Dr
- 404 SW Victor Dr
- 512 SW Victor Dr