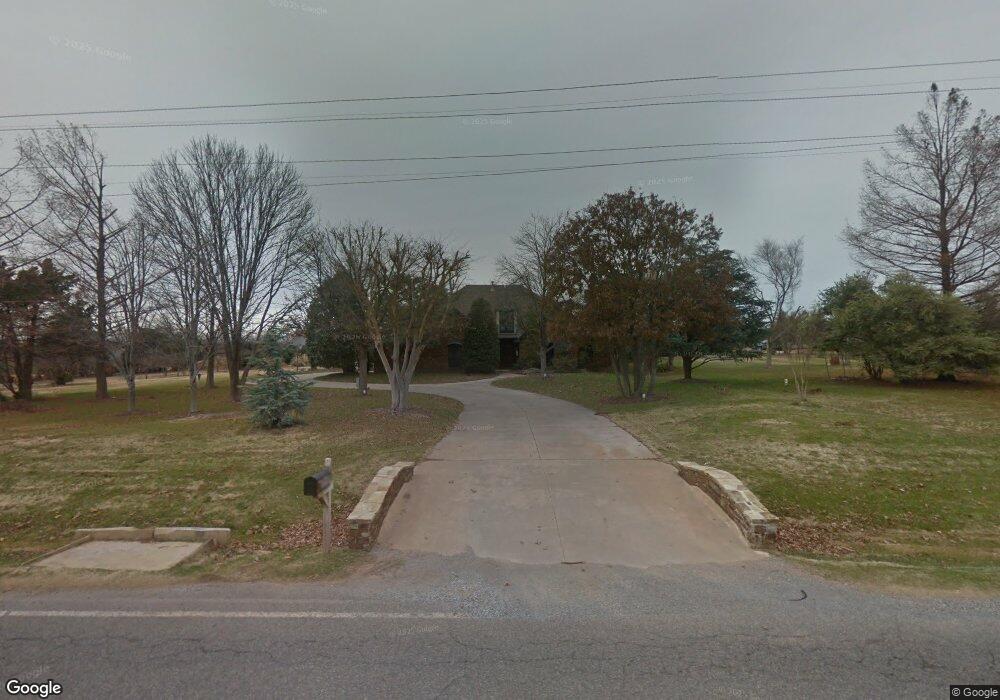
1101 W Sw 89th St Mustang, OK 73064
Estimated Value: $474,000 - $537,000
3
Beds
4
Baths
3,282
Sq Ft
$154/Sq Ft
Est. Value
About This Home
This home is located at 1101 W Sw 89th St, Mustang, OK 73064 and is currently estimated at $504,814, approximately $153 per square foot. 1101 W Sw 89th St is a home located in Canadian County with nearby schools including Mustang Centennial Elementary School, Mustang Horizon Intermediate School, and Mustang Middle School.
Ownership History
Date
Name
Owned For
Owner Type
Purchase Details
Closed on
Jan 5, 2016
Sold by
Lindsey R Michael and Lindsey Karen M
Bought by
Lindsey R Michael and Lindsey Karen M
Current Estimated Value
Purchase Details
Closed on
Nov 21, 2007
Sold by
Lindsey Karen M and Lindsey Robert M
Bought by
Lindsey Robert M and Lindsey Karen M
Home Financials for this Owner
Home Financials are based on the most recent Mortgage that was taken out on this home.
Original Mortgage
$230,600
Interest Rate
6.43%
Mortgage Type
New Conventional
Purchase Details
Closed on
Feb 20, 1996
Sold by
Lindsey Lindsey R and Lindsey Karen M
Purchase Details
Closed on
Aug 4, 1993
Sold by
J R Bowers Jr Constr Co Inc
Purchase Details
Closed on
Dec 8, 1992
Sold by
Lindsey Lindsey R and Lindsey Karen M
Purchase Details
Closed on
Oct 30, 1992
Sold by
Lindsey Lindsey R and Lindsey Karen M
Purchase Details
Closed on
Apr 4, 1990
Create a Home Valuation Report for This Property
The Home Valuation Report is an in-depth analysis detailing your home's value as well as a comparison with similar homes in the area
Home Values in the Area
Average Home Value in this Area
Purchase History
| Date | Buyer | Sale Price | Title Company |
|---|---|---|---|
| Lindsey R Michael | -- | None Available | |
| Lindsey Robert M | -- | None Available | |
| -- | -- | -- | |
| -- | $164,500 | -- | |
| -- | -- | -- | |
| -- | -- | -- | |
| -- | $19,000 | -- |
Source: Public Records
Mortgage History
| Date | Status | Borrower | Loan Amount |
|---|---|---|---|
| Closed | Lindsey Robert M | $230,600 |
Source: Public Records
Tax History Compared to Growth
Tax History
| Year | Tax Paid | Tax Assessment Tax Assessment Total Assessment is a certain percentage of the fair market value that is determined by local assessors to be the total taxable value of land and additions on the property. | Land | Improvement |
|---|---|---|---|---|
| 2024 | $4,293 | $45,346 | $9,000 | $36,346 |
| 2023 | $4,293 | $44,026 | $9,000 | $35,026 |
| 2022 | $4,215 | $42,744 | $9,000 | $33,744 |
| 2021 | $4,168 | $42,110 | $9,000 | $33,110 |
| 2020 | $4,068 | $40,883 | $9,000 | $31,883 |
| 2019 | $3,947 | $39,692 | $9,000 | $30,692 |
| 2018 | $4,017 | $38,536 | $9,000 | $29,536 |
| 2017 | $3,918 | $38,021 | $8,657 | $29,364 |
| 2016 | $3,739 | $37,949 | $9,000 | $28,949 |
| 2015 | $3,411 | $34,486 | $7,314 | $27,172 |
| 2014 | $3,411 | $32,844 | $6,000 | $26,844 |
Source: Public Records
Map
Nearby Homes
- 1315 S Grace Dr
- 525 W Ava Dr
- 1302 S Silver Dr
- 10009 SW 39th St
- 10013 SW 39th St
- 12100 SW 36th St
- 1405 S Dean Dr
- 632 W Carson Dr
- 1509 S Clear Springs Rd
- 520 S Owen Dr
- 850 W Forest Dr
- 844 W Forest Dr
- 12116 SW 36th St
- 12112 SW 36th St
- 12108 SW 36th St
- 12104 SW 36th St
- 635 W Hillcrest Dr
- 613 W Greenwood Ct
- 1907 W Cedar Ridge Dr
- 11933 SW 104th St
- 1421 S Ebeling Dr
- 1508 S Ebeling Dr
- 1502 S Ebeling Dr
- 12424 SW 89th St
- 1333 S Ebeling Dr
- 1416 S Ebeling Dr
- 1422 S Lariat Dr
- 12536 SW 89th St
- 9100 S Peggy Ln
- 1505 S Lariat Dr
- 1315 S Ebeling Dr
- 1326 S Lariat Dr
- 1507 S Chuckwagon Dr
- 12540 SW 89th St
- 12540 SW 89th St
- 1401 S Lariat Dr
- 1501 S Chuckwagon Dr
- 1413 Jake Ct
- 1328 S Rae Dr
- 1401 Jake Ct