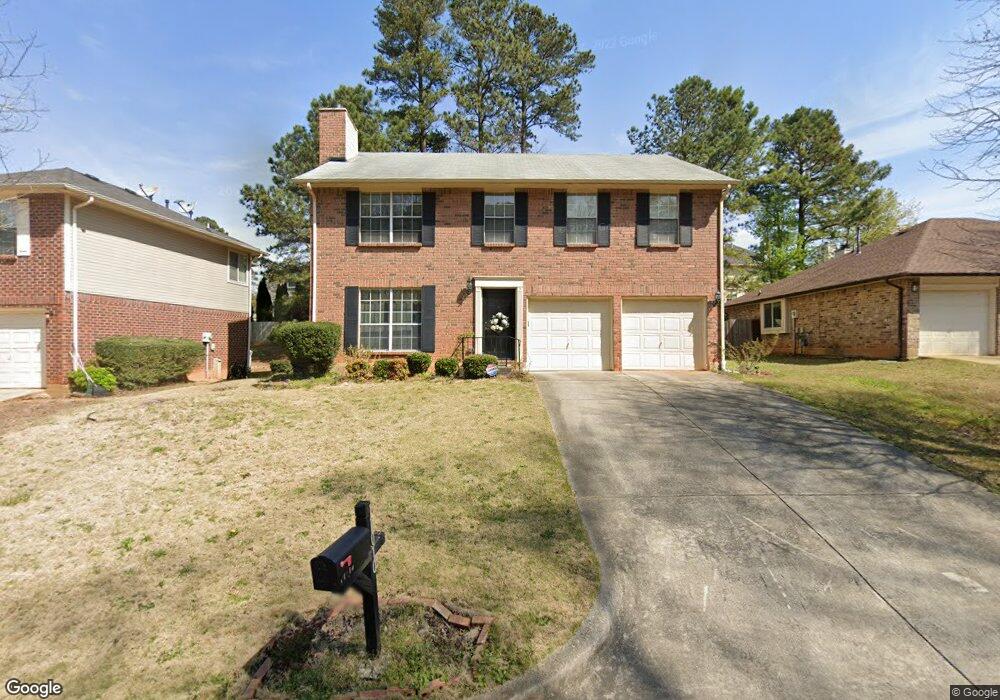
11010 Mortons Crossing Unit 1B Alpharetta, GA 30022
Estimated Value: $533,055 - $572,000
4
Beds
3
Baths
2,240
Sq Ft
$245/Sq Ft
Est. Value
About This Home
This home is located at 11010 Mortons Crossing Unit 1B, Alpharetta, GA 30022 and is currently estimated at $548,764, approximately $244 per square foot. 11010 Mortons Crossing Unit 1B is a home located in Fulton County with nearby schools including State Bridge Crossing Elementary School, Taylor Road Middle School, and Chattahoochee High School.
Ownership History
Date
Name
Owned For
Owner Type
Purchase Details
Closed on
Jun 15, 2005
Sold by
Surovets Daniel Y and Surovets Maya
Bought by
Goulbourne Sheila I
Current Estimated Value
Home Financials for this Owner
Home Financials are based on the most recent Mortgage that was taken out on this home.
Original Mortgage
$103,650
Outstanding Balance
$53,448
Interest Rate
5.57%
Mortgage Type
New Conventional
Estimated Equity
$495,316
Purchase Details
Closed on
Apr 15, 2005
Sold by
Surovets Daniel Y and Surovets Maya
Bought by
Goulbourne Sheila I
Home Financials for this Owner
Home Financials are based on the most recent Mortgage that was taken out on this home.
Original Mortgage
$103,650
Interest Rate
5.79%
Mortgage Type
New Conventional
Purchase Details
Closed on
Dec 27, 2000
Sold by
Beavers Robert I
Bought by
Imanova Maya V
Home Financials for this Owner
Home Financials are based on the most recent Mortgage that was taken out on this home.
Original Mortgage
$158,119
Interest Rate
7.75%
Mortgage Type
FHA
Create a Home Valuation Report for This Property
The Home Valuation Report is an in-depth analysis detailing your home's value as well as a comparison with similar homes in the area
Home Values in the Area
Average Home Value in this Area
Purchase History
| Date | Buyer | Sale Price | Title Company |
|---|---|---|---|
| Goulbourne Sheila I | $188,500 | -- | |
| Goulbourne Sheila I | $188,500 | -- | |
| Imanova Maya V | $159,000 | -- |
Source: Public Records
Mortgage History
| Date | Status | Borrower | Loan Amount |
|---|---|---|---|
| Open | Goulbourne Sheila I | $103,650 | |
| Previous Owner | Goulbourne Sheila I | $103,650 | |
| Previous Owner | Imanova Maya V | $158,119 |
Source: Public Records
Tax History Compared to Growth
Tax History
| Year | Tax Paid | Tax Assessment Tax Assessment Total Assessment is a certain percentage of the fair market value that is determined by local assessors to be the total taxable value of land and additions on the property. | Land | Improvement |
|---|---|---|---|---|
| 2025 | $622 | $217,640 | $38,280 | $179,360 |
| 2023 | $4,815 | $170,600 | $31,000 | $139,600 |
| 2022 | $883 | $132,320 | $32,760 | $99,560 |
| 2021 | $835 | $116,680 | $27,080 | $89,600 |
| 2020 | $822 | $115,320 | $26,760 | $88,560 |
| 2019 | $291 | $113,280 | $26,280 | $87,000 |
| 2018 | $2,552 | $95,520 | $18,360 | $77,160 |
| 2017 | $2,315 | $81,000 | $12,640 | $68,360 |
| 2016 | $2,262 | $81,000 | $12,640 | $68,360 |
| 2015 | $2,286 | $81,000 | $12,640 | $68,360 |
| 2014 | $1,958 | $68,560 | $10,680 | $57,880 |
Source: Public Records
Map
Nearby Homes
- 200 Boca Ciega Ct
- 5022 Anclote Dr
- 4815 Tanners Spring Dr
- 4965 Cinnabar Dr
- 225 Morton Creek Cir
- 5060 Cinnabar Dr
- 4826 Abberley Ln
- 220 Magnolia Tree Ct
- 10906 Gallier St
- 465 Mikasa Dr
- 4965 N Bridges Dr
- 230 Pinebridge Ct
- 10570 Bridgemor Dr
- 5425 Taylor Rd Unit 2
- 4740 Carversham Way
- 130 Douglas Fir Ct Unit 1
- 11150 Highfield Chase Dr
- 4790 Roswell Mill Dr
- 4645 Valais Ct Unit 109
- 11020 Mortons Crossing
- 11000 Mortons Crossing
- 315 Tanners Crossing
- 305 Tanners Crossing
- 11030 Mortons Crossing
- 325 Tanners Crossing Unit III
- 335 Tanners Crossing
- 0 Tanners Crossing Unit 3253018
- 0 Tanners Crossing Unit 3212039
- 0 Tanners Crossing Unit 8727450
- 0 Tanners Crossing Unit 8561498
- 0 Tanners Crossing Unit 8456922
- 0 Tanners Crossing Unit 8412009
- 0 Tanners Crossing Unit 8007647
- 0 Tanners Crossing
- 10915 Mortons Crossing Unit 1B
- 11040 Mortons Crossing
- 10925 Mortons Crossing
- 10980 Mortons Crossing
- 10905 Mortons Crossing