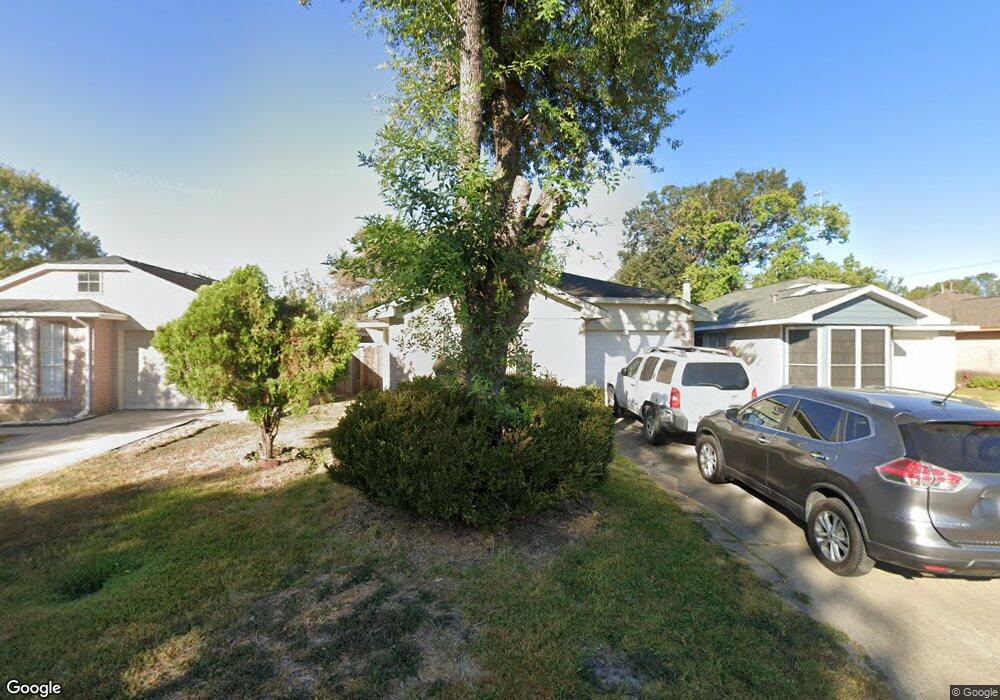
11011 Threeawn Ct Houston, TX 77086
North Houston NeighborhoodEstimated Value: $177,542 - $197,000
3
Beds
2
Baths
1,386
Sq Ft
$134/Sq Ft
Est. Value
About This Home
This home is located at 11011 Threeawn Ct, Houston, TX 77086 and is currently estimated at $185,636, approximately $133 per square foot. 11011 Threeawn Ct is a home located in Harris County with nearby schools including Kujawa EC/Pre-K/K School, Carmichael Elementary School, and Shotwell Middle School.
Ownership History
Date
Name
Owned For
Owner Type
Purchase Details
Closed on
Jul 10, 1998
Sold by
Hud
Bought by
Lazo Alfonso and Lazo Maritza
Current Estimated Value
Home Financials for this Owner
Home Financials are based on the most recent Mortgage that was taken out on this home.
Original Mortgage
$47,694
Outstanding Balance
$9,837
Interest Rate
7.09%
Mortgage Type
FHA
Estimated Equity
$175,799
Purchase Details
Closed on
Mar 17, 1998
Sold by
Countrywide Home Loans Inc
Bought by
Hud
Purchase Details
Closed on
Dec 2, 1997
Sold by
Booker Reba Diane and Perry Brenda Lee
Bought by
Countrywide Home Loans Inc
Purchase Details
Closed on
Sep 26, 1994
Sold by
Roberson Martha L Thompson and Roberson Leonard R
Bought by
Booker Reba Diane and Perry Brenda Lee
Home Financials for this Owner
Home Financials are based on the most recent Mortgage that was taken out on this home.
Original Mortgage
$42,800
Interest Rate
8.62%
Mortgage Type
FHA
Create a Home Valuation Report for This Property
The Home Valuation Report is an in-depth analysis detailing your home's value as well as a comparison with similar homes in the area
Home Values in the Area
Average Home Value in this Area
Purchase History
| Date | Buyer | Sale Price | Title Company |
|---|---|---|---|
| Lazo Alfonso | $48,088 | American Title Co | |
| Hud | -- | -- | |
| Countrywide Home Loans Inc | $45,248 | -- | |
| Booker Reba Diane | -- | Stewart Title |
Source: Public Records
Mortgage History
| Date | Status | Borrower | Loan Amount |
|---|---|---|---|
| Open | Lazo Alfonso | $47,694 | |
| Previous Owner | Booker Reba Diane | $42,800 |
Source: Public Records
Tax History Compared to Growth
Tax History
| Year | Tax Paid | Tax Assessment Tax Assessment Total Assessment is a certain percentage of the fair market value that is determined by local assessors to be the total taxable value of land and additions on the property. | Land | Improvement |
|---|---|---|---|---|
| 2025 | $1,172 | $171,185 | $28,833 | $142,352 |
| 2024 | $1,172 | $171,185 | $24,139 | $147,046 |
| 2023 | $1,172 | $171,185 | $24,139 | $147,046 |
| 2022 | $2,089 | $149,612 | $18,104 | $131,508 |
| 2021 | $1,995 | $126,071 | $18,104 | $107,967 |
| 2020 | $1,930 | $123,438 | $18,104 | $105,334 |
| 2019 | $1,869 | $115,522 | $18,104 | $97,418 |
| 2018 | $587 | $89,905 | $18,104 | $71,801 |
| 2017 | $1,639 | $89,905 | $18,104 | $71,801 |
| 2016 | $1,490 | $64,507 | $18,104 | $46,403 |
| 2015 | $1,063 | $66,964 | $10,058 | $56,906 |
| 2014 | $1,063 | $45,000 | $10,058 | $34,942 |
Source: Public Records
Map
Nearby Homes
- 7227 Greenyard Dr
- 7222 Northleaf Dr
- 7218 Winding Trace Dr
- 5010 Kale Ct
- 10711 Heather Hill Dr
- 5103 Dartmoor Ridge Trail
- 10723 Mackenzie Dr
- 10614 Mackenzie Dr
- 11007 Tobasa Ct
- 7023 Sandswept Ln
- 7002 Sandswept Ln
- 10307 Bammel North Houston Rd
- 11006 Crinkleawn Dr
- 11532 Champions Green Dr
- 7302 Seton Lake Dr
- 11021 Crenchrus Ct
- 6722 Winding Trace Dr
- 6654 Brownie Campbell Rd
- 11009 Panicum Ct
- 7307 Silver Star Dr
- 11009 Threeawn Ct
- 11015 Threeawn Ct
- 11007 Threeawn Ct
- 11017 Threeawn Ct
- 11012 Marshhay Ct
- 11008 Marshhay Ct
- 11014 Marshhay Ct
- 11003 Threeawn Ct
- 11006 Marshhay Ct
- 11016 Marshhay Ct
- 11012 Threeawn Ct
- 11008 Threeawn Ct
- 11014 Threeawn Ct
- 11002 Marshhay Ct
- 11006 Threeawn Ct
- 11021 Threeawn Ct
- 11016 Threeawn Ct
- 11020 Marshhay Ct
- 11002 Threeawn Ct
- 11025 Threeawn Ct