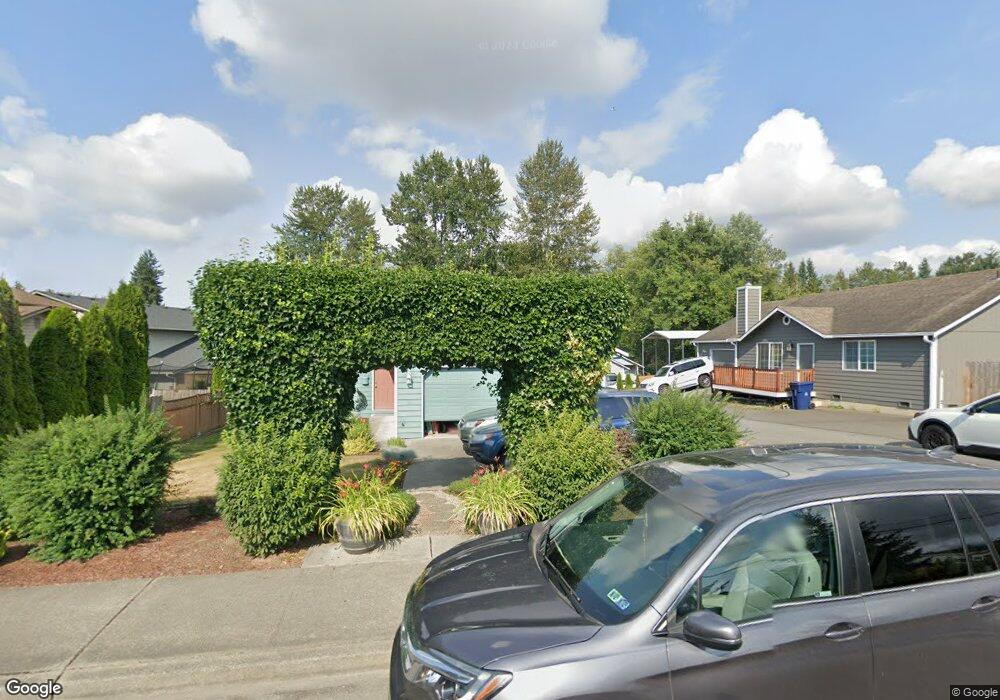
11017 Paine Field Way Everett, WA 98204
Holly NeighborhoodEstimated Value: $572,150 - $640,000
3
Beds
2
Baths
1,148
Sq Ft
$537/Sq Ft
Est. Value
About This Home
This home is located at 11017 Paine Field Way, Everett, WA 98204 and is currently estimated at $616,788, approximately $537 per square foot. 11017 Paine Field Way is a home located in Snohomish County with nearby schools including Fairmount Elementary School, Explorer Middle School, and Mariner High School.
Ownership History
Date
Name
Owned For
Owner Type
Purchase Details
Closed on
Sep 10, 2008
Sold by
Bohannon David L and Kovar Vicki L
Bought by
Bohannon David L and Kovar Vicki L
Current Estimated Value
Home Financials for this Owner
Home Financials are based on the most recent Mortgage that was taken out on this home.
Original Mortgage
$116,660
Interest Rate
6.09%
Mortgage Type
Purchase Money Mortgage
Purchase Details
Closed on
Sep 17, 1996
Sold by
Theo Construction Inc
Bought by
Bohannon David L and Kovar Vicki L
Home Financials for this Owner
Home Financials are based on the most recent Mortgage that was taken out on this home.
Original Mortgage
$125,869
Interest Rate
7.88%
Mortgage Type
FHA
Purchase Details
Closed on
Jan 2, 1996
Sold by
North Sound Enterprises Llc
Bought by
Selby Johnson Construction Inc
Create a Home Valuation Report for This Property
The Home Valuation Report is an in-depth analysis detailing your home's value as well as a comparison with similar homes in the area
Home Values in the Area
Average Home Value in this Area
Purchase History
| Date | Buyer | Sale Price | Title Company |
|---|---|---|---|
| Bohannon David L | -- | Lsi | |
| Bohannon David L | $125,950 | Chicago Title Insurance Co | |
| Selby Johnson Construction Inc | $132,500 | Chicago Title Insurance Co | |
| Dorrah Loren W | $132,500 | Chicago Title Insurance Co |
Source: Public Records
Mortgage History
| Date | Status | Borrower | Loan Amount |
|---|---|---|---|
| Closed | Bohannon David L | $116,660 | |
| Closed | Bohannon David L | $125,869 |
Source: Public Records
Tax History Compared to Growth
Tax History
| Year | Tax Paid | Tax Assessment Tax Assessment Total Assessment is a certain percentage of the fair market value that is determined by local assessors to be the total taxable value of land and additions on the property. | Land | Improvement |
|---|---|---|---|---|
| 2025 | $3,662 | $483,000 | $290,600 | $192,400 |
| 2024 | $3,662 | $472,300 | $279,900 | $192,400 |
| 2023 | $3,370 | $445,700 | $269,300 | $176,400 |
| 2022 | $3,087 | $353,700 | $195,300 | $158,400 |
| 2020 | $2,719 | $313,000 | $170,300 | $142,700 |
| 2019 | $2,326 | $271,200 | $138,000 | $133,200 |
| 2018 | $2,486 | $249,600 | $122,000 | $127,600 |
| 2017 | $2,228 | $228,900 | $113,000 | $115,900 |
| 2016 | $1,909 | $194,200 | $84,000 | $110,200 |
| 2015 | $1,916 | $176,100 | $84,000 | $92,100 |
| 2013 | $2,048 | $175,300 | $84,000 | $91,300 |
Source: Public Records
Map
Nearby Homes
- 2006 112th St SW
- 1807 112th St SW
- 10724 21st Place W Unit A
- 10000 23rd Ave W
- 1520 Hollow Dale Place Unit B
- 1518 Hollow Dale Place Unit A
- 1518 Hollow Dale Place Unit D
- 11517 Marino Ave Unit B
- 11527 Highway 99 Unit B303
- 11527 Highway 99 Unit C102
- 2101 Center Rd
- 2312 117th Place SW
- 1615 106th St SW
- 11527 Hwy 99 Unit C106
- 14000 Center Rd
- 24 XX Center Rd
- 11626 Admiralty Way Unit A
- 11918 Airport Rd
- 1131 115th St SW Unit J3
- 1131 115th St SW Unit M2
- 11031 Paine Field Way
- 2040 Hollow Dale Place
- 2030 Hollow Dale Place
- 11023 Paine Field Way
- 11029 Paine Field Way
- 2020 Hollow Dale Place
- 11050 Paine Field Way
- 11020 Paine Field Way
- 1929 111th Place SW
- 1923 111th Place SW
- 2010 Hollow Dale Place
- 1917 111th Place SW
- 11022 Paine Field Way
- 11018 Paine Field Way
- 11102 Paine Field Way
- 11048 Paine Field Way
- 11104 Paine Field Way Unit I
- 11104 Paine Field Way Unit 13
- 2031 Hollow Dale Place