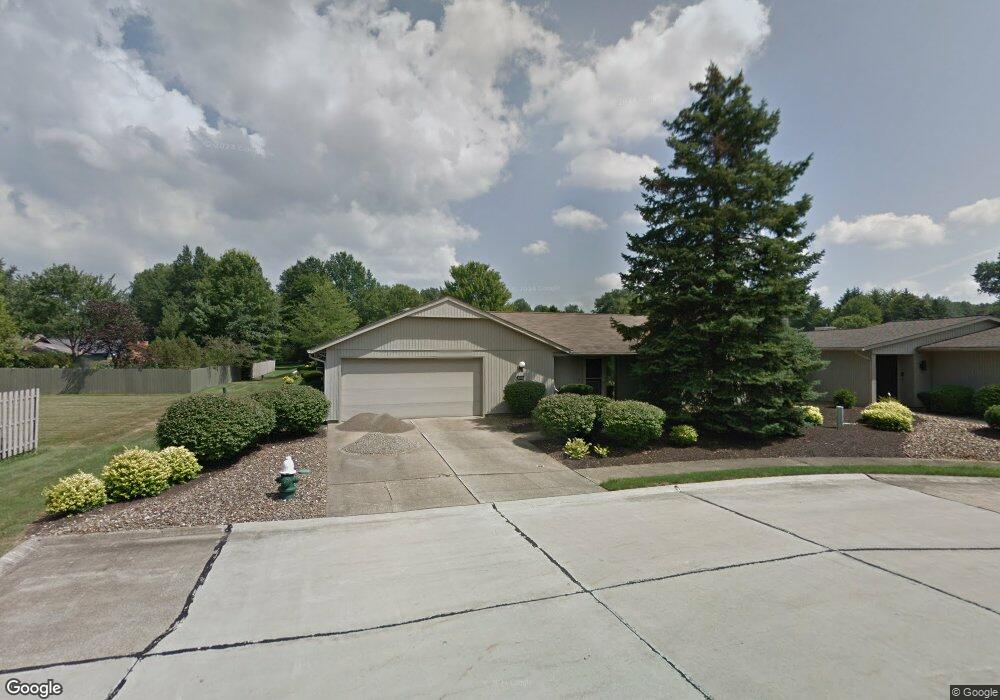
11017 Southwind Ct Strongsville, OH 44149
Estimated Value: $332,000 - $363,000
3
Beds
2
Baths
2,210
Sq Ft
$154/Sq Ft
Est. Value
About This Home
This home is located at 11017 Southwind Ct, Strongsville, OH 44149 and is currently estimated at $340,648, approximately $154 per square foot. 11017 Southwind Ct is a home located in Cuyahoga County with nearby schools including Strongsville High School and Sts Joseph & John Interparochial School.
Ownership History
Date
Name
Owned For
Owner Type
Purchase Details
Closed on
Aug 30, 2008
Sold by
Stiff Stephen and Stiff Kathi
Bought by
Urbancik Denise I
Current Estimated Value
Home Financials for this Owner
Home Financials are based on the most recent Mortgage that was taken out on this home.
Original Mortgage
$100,000
Outstanding Balance
$66,227
Interest Rate
6.43%
Mortgage Type
Purchase Money Mortgage
Estimated Equity
$274,421
Purchase Details
Closed on
Feb 27, 2008
Sold by
Jewitt Jeffrey B and Jewitt Susan L
Bought by
Stiff Stephen and Stiff Kathi
Home Financials for this Owner
Home Financials are based on the most recent Mortgage that was taken out on this home.
Original Mortgage
$26,200
Interest Rate
5.75%
Mortgage Type
Credit Line Revolving
Purchase Details
Closed on
Mar 27, 1992
Bought by
Jewitt Jeffrey B
Purchase Details
Closed on
Jan 1, 1980
Bought by
Title Guarantee & Trust Tr
Create a Home Valuation Report for This Property
The Home Valuation Report is an in-depth analysis detailing your home's value as well as a comparison with similar homes in the area
Home Values in the Area
Average Home Value in this Area
Purchase History
| Date | Buyer | Sale Price | Title Company |
|---|---|---|---|
| Urbancik Denise I | $166,000 | Lawyers Title Ins | |
| Stiff Stephen | $175,000 | Real Living Title Agency L | |
| Jewitt Jeffrey B | $90,700 | -- | |
| Title Guarantee & Trust Tr | -- | -- |
Source: Public Records
Mortgage History
| Date | Status | Borrower | Loan Amount |
|---|---|---|---|
| Open | Urbancik Denise I | $100,000 | |
| Previous Owner | Stiff Stephen | $26,200 | |
| Previous Owner | Stiff Stephen | $140,000 |
Source: Public Records
Tax History Compared to Growth
Tax History
| Year | Tax Paid | Tax Assessment Tax Assessment Total Assessment is a certain percentage of the fair market value that is determined by local assessors to be the total taxable value of land and additions on the property. | Land | Improvement |
|---|---|---|---|---|
| 2024 | $4,100 | $97,125 | $23,625 | $73,500 |
| 2023 | $3,897 | $71,400 | $21,980 | $49,420 |
| 2022 | $3,894 | $71,400 | $21,980 | $49,420 |
| 2021 | $3,864 | $71,400 | $21,980 | $49,420 |
| 2020 | $3,470 | $58,520 | $18,030 | $40,500 |
| 2019 | $3,368 | $167,200 | $51,500 | $115,700 |
| 2018 | $3,594 | $58,520 | $18,030 | $40,500 |
| 2017 | $3,618 | $54,540 | $13,690 | $40,850 |
| 2016 | $3,589 | $54,540 | $13,690 | $40,850 |
| 2015 | $3,714 | $54,540 | $13,690 | $40,850 |
| 2014 | $3,714 | $55,660 | $13,970 | $41,690 |
Source: Public Records
Map
Nearby Homes
- 11030 Southwind Ct
- 10842 Fence Row Dr
- 10824 Watercress Rd
- 0 Priem Rd
- 10800 Meadow Trail
- 22300 Rock Creek Cir
- 10008 Plum Brook Ln
- 10353 Oak Branch Trail
- 11405 Reserve Way
- 9829 Plum Brook Ln
- 21359 Briar Bush Ln
- 9741 Pebble Brook Ln
- 12515 Countryside Dr
- 9598 Pebble Brook Ln
- 21292 Creekside Dr
- 21469 Woodview Cir
- 10839 Prospect Rd
- 12579 Woodberry Ln
- 8746 Barton Dr
- 9384 N Marks Rd
- 11019 Southwind Ct
- 11008 Eastwind Ct
- 11010 Eastwind Ct
- 11021 Southwind Ct
- 11012 Eastwind Ct
- 10837 Fence Row Dr
- 11014 Eastwind Ct
- 11023 Southwind Ct
- 10841 Fence Row Dr
- 11016 Eastwind Ct
- 10833 Fence Row Dr
- 11025 Southwind Ct
- 10845 Fence Row Dr
- 11018 Southwind Ct
- 11018 Eastwind Ct
- 11020 Southwind Ct
- 11027 Southwind Ct
- 11022 Southwind Ct
- 10829 Fence Row Dr
- 11020 Eastwind Ct