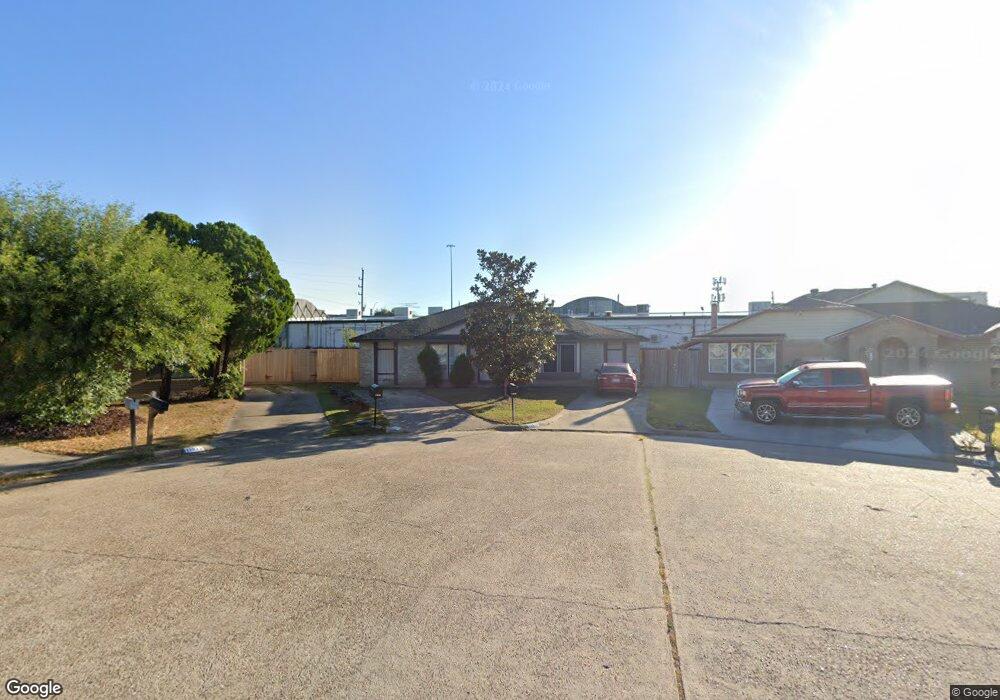
11018 Panicum Ct Houston, TX 77086
North Houston NeighborhoodEstimated Value: $169,000 - $233,000
1
Bed
1
Bath
852
Sq Ft
$242/Sq Ft
Est. Value
About This Home
This home is located at 11018 Panicum Ct, Houston, TX 77086 and is currently estimated at $205,808, approximately $241 per square foot. 11018 Panicum Ct is a home located in Harris County with nearby schools including Kujawa EC/Pre-K/K School, Carmichael Elementary School, and Shotwell Middle School.
Ownership History
Date
Name
Owned For
Owner Type
Purchase Details
Closed on
Jul 29, 2023
Sold by
Volpe Anthony S
Bought by
Volpe Anthony S and Volpe Sheila
Current Estimated Value
Purchase Details
Closed on
Mar 4, 1999
Sold by
Bates Russell S
Bought by
Volpe Anthony S
Home Financials for this Owner
Home Financials are based on the most recent Mortgage that was taken out on this home.
Original Mortgage
$49,500
Interest Rate
6.89%
Mortgage Type
Purchase Money Mortgage
Purchase Details
Closed on
Nov 10, 1998
Sold by
Kalef Charlie N
Bought by
Bates Russell S
Create a Home Valuation Report for This Property
The Home Valuation Report is an in-depth analysis detailing your home's value as well as a comparison with similar homes in the area
Home Values in the Area
Average Home Value in this Area
Purchase History
| Date | Buyer | Sale Price | Title Company |
|---|---|---|---|
| Volpe Anthony S | -- | None Listed On Document | |
| Volpe Anthony S | -- | Texas Gulf Title Inc | |
| Bates Russell S | -- | -- |
Source: Public Records
Mortgage History
| Date | Status | Borrower | Loan Amount |
|---|---|---|---|
| Previous Owner | Volpe Anthony S | $49,500 |
Source: Public Records
Tax History Compared to Growth
Tax History
| Year | Tax Paid | Tax Assessment Tax Assessment Total Assessment is a certain percentage of the fair market value that is determined by local assessors to be the total taxable value of land and additions on the property. | Land | Improvement |
|---|---|---|---|---|
| 2025 | $1,964 | $215,210 | $59,589 | $155,621 |
| 2024 | $1,964 | $218,300 | $49,889 | $168,411 |
| 2023 | $1,964 | $221,158 | $49,889 | $171,269 |
| 2022 | $2,537 | $158,973 | $31,181 | $127,792 |
| 2021 | $2,423 | $154,426 | $31,181 | $123,245 |
| 2020 | $2,344 | $136,000 | $31,181 | $104,819 |
| 2019 | $2,269 | $132,304 | $31,181 | $101,123 |
| 2018 | $647 | $107,553 | $31,181 | $76,372 |
| 2017 | $2,020 | $80,000 | $20,787 | $59,213 |
| 2016 | $1,836 | $80,000 | $20,787 | $59,213 |
| 2015 | $943 | $81,047 | $20,787 | $60,260 |
| 2014 | $943 | $61,297 | $20,787 | $40,510 |
Source: Public Records
Map
Nearby Homes
- 11009 Panicum Ct
- 11021 Crenchrus Ct
- 6610 Northleaf Dr
- 11006 Crinkleawn Dr
- 6630 Brownie Campbell Rd
- 6654 Brownie Campbell Rd
- 11007 Tobasa Ct
- 6722 Winding Trace Dr
- 6615 Winding Trace Dr
- 10522 Northview Dr
- 6502 Trail Valley Way
- 7002 Sandswept Ln
- 13610 Kaltenbrun Rd
- 7218 Winding Trace Dr
- 7023 Sandswept Ln
- 13518 Kaltenbrun Rd
- 7222 Northleaf Dr
- 7227 Greenyard Dr
- 6911 Silver Star Dr
- 3240 Brownie Campbell Rd
- 11020 Panicum Ct
- 11022 Panicum Ct
- 11016 Panicum Ct
- 11024 Panicum Ct
- 11014 Panicum Ct
- 11012 Panicum Ct
- 11025 Panicum Ct
- 11010 Panicum Ct
- 11023 Panicum Ct
- 11021 Panicum Ct
- 11017 Panicum Ct
- 11019 Panicum Ct
- 11008 Panicum Ct
- 11015 Panicum Ct
- 11013 Panicum Ct
- 11006 Panicum Ct
- 11011 Panicum Ct
- 11004 Panicum Ct
- 11018 Crenchrus Ct
- 11020 Crenchrus Ct