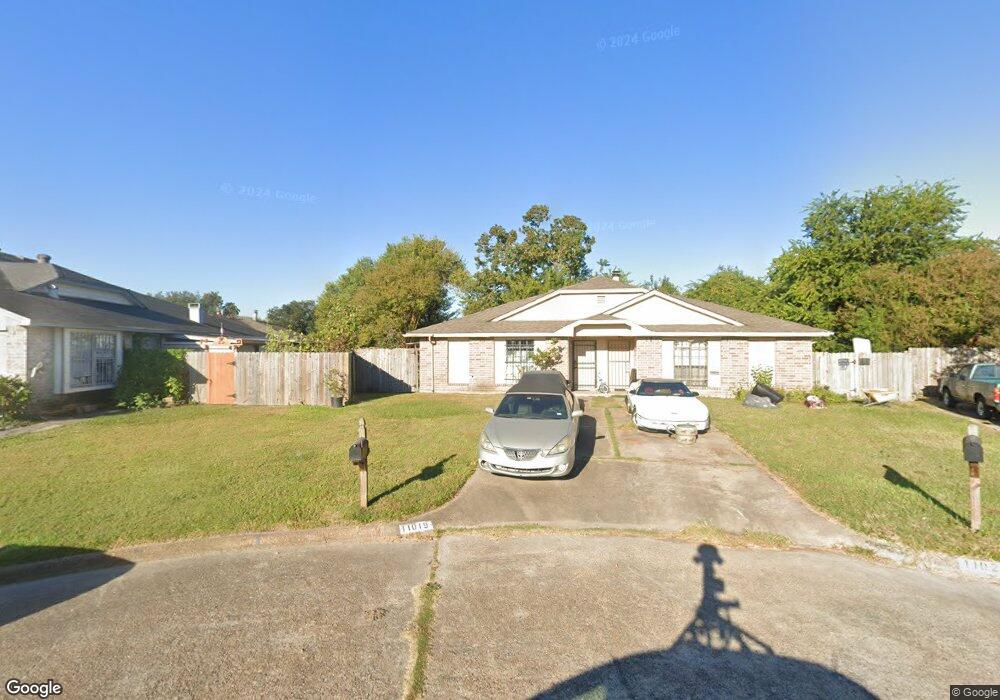
11019 Panicum Ct Houston, TX 77086
North Houston NeighborhoodEstimated Value: $127,000 - $157,000
1
Bed
1
Bath
852
Sq Ft
$165/Sq Ft
Est. Value
About This Home
This home is located at 11019 Panicum Ct, Houston, TX 77086 and is currently estimated at $140,861, approximately $165 per square foot. 11019 Panicum Ct is a home located in Harris County with nearby schools including Kujawa EC/Pre-K/K School, Carmichael Elementary School, and Shotwell Middle School.
Ownership History
Date
Name
Owned For
Owner Type
Purchase Details
Closed on
Jul 28, 2023
Sold by
Halmaghi George
Bought by
Sibiu Investments Llc
Current Estimated Value
Purchase Details
Closed on
Oct 3, 2022
Sold by
Beneficial Fortitude Funds Llc
Bought by
3 Origin Investments Llc
Purchase Details
Closed on
Apr 28, 2017
Sold by
Beneficial Fortitude Finds Llc
Bought by
3 Origin Investments Llc
Purchase Details
Closed on
Jun 24, 2016
Sold by
Lebui Investments Llc
Bought by
Beneficial Firtitude Fonds Llc
Purchase Details
Closed on
Apr 5, 2016
Sold by
Garland Jackson Arianne and Garland Thomas Jr Richard
Bought by
Lebui Investments Llc
Create a Home Valuation Report for This Property
The Home Valuation Report is an in-depth analysis detailing your home's value as well as a comparison with similar homes in the area
Home Values in the Area
Average Home Value in this Area
Purchase History
| Date | Buyer | Sale Price | Title Company |
|---|---|---|---|
| Sibiu Investments Llc | -- | None Listed On Document | |
| 3 Origin Investments Llc | -- | -- | |
| Beneficial Fortitude Funds Llc | -- | -- | |
| 3 Origin Investments Llc | -- | None Available | |
| Beneficial Firtitude Fonds Llc | -- | None Available | |
| Lebui Investments Llc | $60,000 | None Available |
Source: Public Records
Mortgage History
| Date | Status | Borrower | Loan Amount |
|---|---|---|---|
| Closed | 3 Origin Investments Llc | $0 |
Source: Public Records
Tax History Compared to Growth
Tax History
| Year | Tax Paid | Tax Assessment Tax Assessment Total Assessment is a certain percentage of the fair market value that is determined by local assessors to be the total taxable value of land and additions on the property. | Land | Improvement |
|---|---|---|---|---|
| 2025 | $2,532 | $124,489 | $29,799 | $94,690 |
| 2024 | $2,532 | $125,302 | $24,948 | $100,354 |
| 2023 | $2,532 | $125,302 | $24,948 | $100,354 |
| 2022 | $2,379 | $109,809 | $15,593 | $94,216 |
| 2021 | $2,014 | $88,497 | $15,593 | $72,904 |
| 2020 | $1,967 | $81,242 | $15,593 | $65,649 |
| 2019 | $1,944 | $75,385 | $15,593 | $59,792 |
| 2018 | $872 | $60,736 | $15,593 | $45,143 |
| 2017 | $1,367 | $49,970 | $10,395 | $39,575 |
| 2016 | $1,367 | $49,970 | $10,395 | $39,575 |
| 2015 | $1,006 | $46,015 | $10,395 | $35,620 |
| 2014 | $1,006 | $34,328 | $10,395 | $23,933 |
Source: Public Records
Map
Nearby Homes
- 11009 Panicum Ct
- 11021 Crenchrus Ct
- 11006 Crinkleawn Dr
- 6610 Northleaf Dr
- 6630 Brownie Campbell Rd
- 6654 Brownie Campbell Rd
- 11007 Tobasa Ct
- 6722 Winding Trace Dr
- 6615 Winding Trace Dr
- 10522 Northview Dr
- 7002 Sandswept Ln
- 6502 Trail Valley Way
- 7218 Winding Trace Dr
- 13610 Kaltenbrun Rd
- 7023 Sandswept Ln
- 7222 Northleaf Dr
- 7227 Greenyard Dr
- 13518 Kaltenbrun Rd
- 5010 Kale Ct
- 6911 Silver Star Dr
- 11017 Panicum Ct
- 11021 Panicum Ct
- 11018 Crenchrus Ct
- 11015 Panicum Ct
- 11020 Crenchrus Ct
- 11023 Panicum Ct
- 11016 Crenchrus Ct
- 11013 Panicum Ct
- 11025 Panicum Ct
- 11014 Crenchrus Ct
- 11022 Crenchrus Ct
- 11012 Crenchrus Ct
- 11011 Panicum Ct
- 11024 Panicum Ct
- 11010 Crenchrus Ct
- 11024 Crenchrus Ct
- 11016 Panicum Ct
- 11014 Panicum Ct
- 11008 Crenchrus Ct
- 11022 Panicum Ct