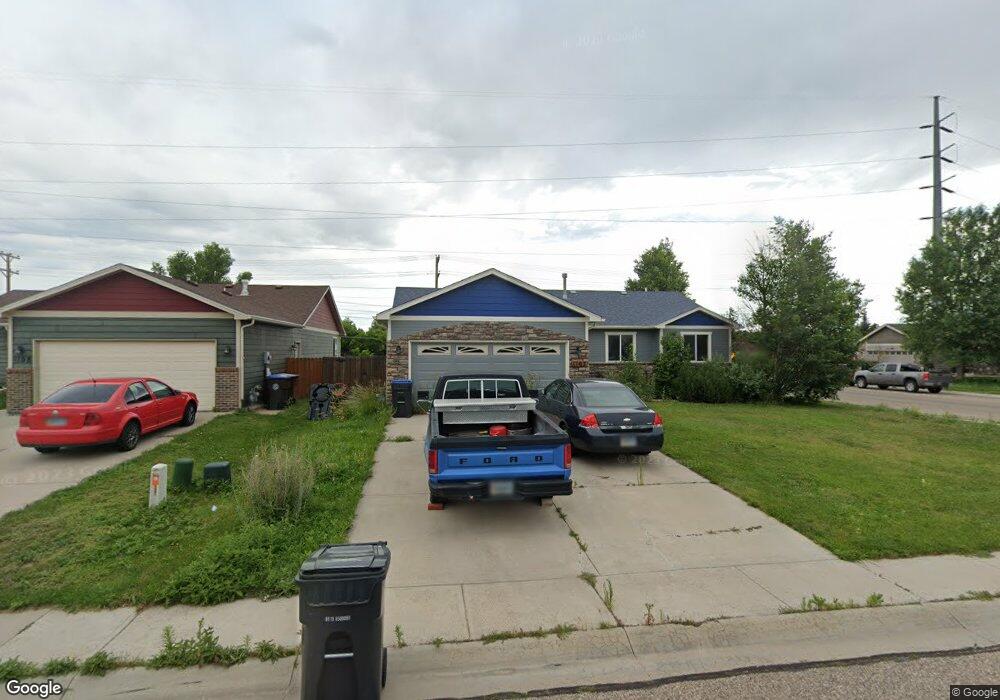
1102 Banjo Ct Cheyenne, WY 82007
Estimated Value: $364,000 - $391,000
Studio
--
Bath
1,309
Sq Ft
$288/Sq Ft
Est. Value
About This Home
This home is located at 1102 Banjo Ct, Cheyenne, WY 82007 and is currently estimated at $377,398, approximately $288 per square foot. 1102 Banjo Ct is a home located in Laramie County with nearby schools including Goins Elementary School, Johnson Junior High School, and South High School.
Ownership History
Date
Name
Owned For
Owner Type
Purchase Details
Closed on
Sep 13, 2005
Sold by
Edeen Land Development Inc
Bought by
Edeen Homes Inc
Current Estimated Value
Home Financials for this Owner
Home Financials are based on the most recent Mortgage that was taken out on this home.
Original Mortgage
$120,775
Outstanding Balance
$64,412
Interest Rate
5.8%
Mortgage Type
Construction
Estimated Equity
$312,986
Purchase Details
Closed on
Aug 30, 2005
Sold by
Edeen Homes Inc
Bought by
Pachniak Thomas A and Pachniak Angela Lt
Home Financials for this Owner
Home Financials are based on the most recent Mortgage that was taken out on this home.
Original Mortgage
$120,775
Outstanding Balance
$64,412
Interest Rate
5.8%
Mortgage Type
Construction
Estimated Equity
$312,986
Purchase Details
Closed on
Mar 17, 2005
Sold by
Edeen Land Development Inc
Bought by
Edeen Homes Inc
Home Financials for this Owner
Home Financials are based on the most recent Mortgage that was taken out on this home.
Original Mortgage
$131,562
Interest Rate
5.66%
Mortgage Type
Construction
Create a Home Valuation Report for This Property
The Home Valuation Report is an in-depth analysis detailing your home's value as well as a comparison with similar homes in the area
Purchase History
| Date | Buyer | Sale Price | Title Company |
|---|---|---|---|
| Edeen Homes Inc | -- | -- | |
| Pachniak Thomas A | -- | -- | |
| Edeen Homes Inc | -- | -- |
Source: Public Records
Mortgage History
| Date | Status | Borrower | Loan Amount |
|---|---|---|---|
| Open | Edeen Homes Inc | $120,775 | |
| Closed | Pachniak Thomas A | $27,421 | |
| Closed | Pachniak Thomas A | $146,248 | |
| Previous Owner | Edeen Homes Inc | $131,562 |
Source: Public Records
Tax History
| Year | Tax Paid | Tax Assessment Tax Assessment Total Assessment is a certain percentage of the fair market value that is determined by local assessors to be the total taxable value of land and additions on the property. | Land | Improvement |
|---|---|---|---|---|
| 2025 | $2,584 | $27,319 | $3,070 | $24,249 |
| 2024 | $2,584 | $36,540 | $4,093 | $32,447 |
| 2023 | $2,629 | $37,184 | $4,093 | $33,091 |
| 2022 | $2,304 | $31,927 | $4,093 | $27,834 |
| 2021 | $2,078 | $28,722 | $4,093 | $24,629 |
| 2020 | $2,002 | $27,750 | $4,093 | $23,657 |
| 2019 | $1,833 | $25,386 | $4,093 | $21,293 |
| 2018 | $1,465 | $23,477 | $4,004 | $19,473 |
| 2017 | $1,446 | $23,038 | $4,004 | $19,034 |
| 2016 | $1,409 | $22,522 | $3,780 | $18,742 |
| 2015 | $1,331 | $18,427 | $3,780 | $14,647 |
| 2014 | $1,318 | $18,125 | $3,780 | $14,345 |
Source: Public Records
Map
Nearby Homes
- 221 Desmet Dr
- 1200 W Jefferson Rd
- 1122 W Leisher Rd
- 305 Kay Ave
- 508 W 2nd St
- 927 Concerto Ln
- 1409 W Jefferson Rd
- 302 Abby Rd
- 1101 Melody Ln
- 216 Cribbon Ave
- 1201 Melody Ln
- TBD Snyder Ave
- 301 Cribbon Ave
- 1407 Concerto Ln
- 1109 S Arp Ave
- 511 W 6th St
- 517 W 6th St
- 222 Hynds Ave
- 1548 Alyssaelaine Dr
- TBD Jefferson Rd
- 1108 Banjo Ct
- 1112 Banjo Ct
- 401 Desmet Dr
- 413 Desmet Dr
- 1103 Banjo Ct
- 1116 Banjo Ct
- 1109 Banjo Ct
- 419 Desmet Dr
- 2000 Good Hearted Place
- 1121 Banjo Ct
- 1113 Banjo Ct
- 425 Desmet Dr
- 290 Desmet Dr
- 1117 Banjo Ct
- 1115 W Jefferson Rd
- 1033 W Jefferson Rd
- 501 Desmet Dr
- 1029 W Jefferson Rd
- 1125 W Jefferson Rd
- 507 Desmet Dr
Your Personal Tour Guide
Ask me questions while you tour the home.