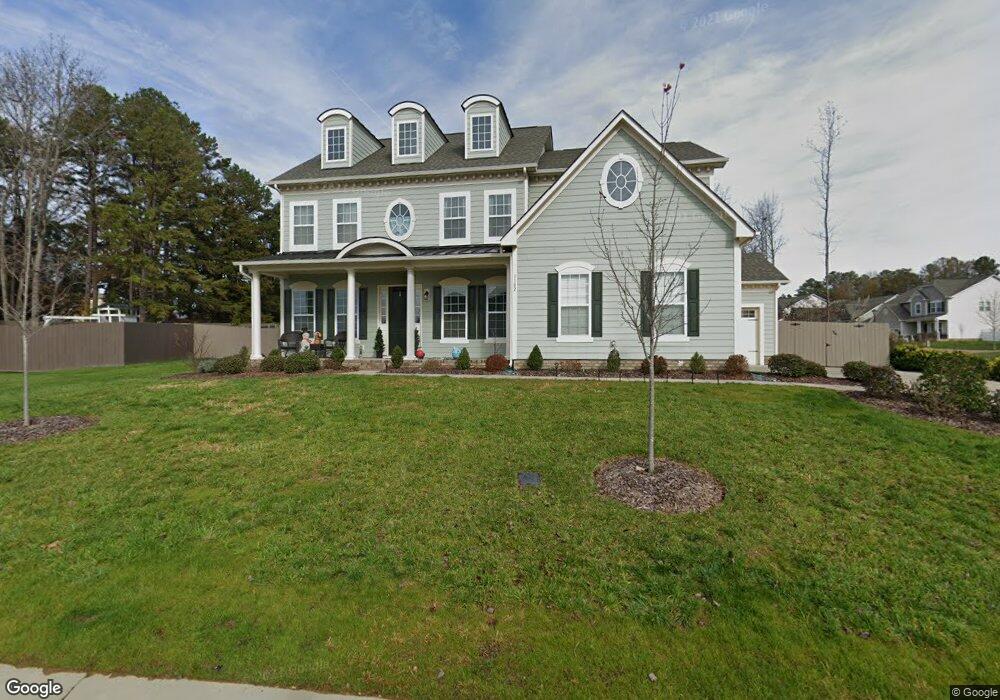
1102 Clover Ln Unit 63 Matthews, NC 28104
Estimated Value: $753,213 - $824,000
5
Beds
6
Baths
3,740
Sq Ft
$210/Sq Ft
Est. Value
About This Home
This home is located at 1102 Clover Ln Unit 63, Matthews, NC 28104 and is currently estimated at $785,303, approximately $209 per square foot. 1102 Clover Ln Unit 63 is a home located in Union County with nearby schools including Indian Trail Elementary School, Sun Valley Middle School, and Sun Valley High School.
Ownership History
Date
Name
Owned For
Owner Type
Purchase Details
Closed on
Nov 10, 2020
Sold by
Kanna Sai Shankar and Kanna Katie Elizabeth
Bought by
Kanna Sai Shankar and Kanna Katie Elizabeth
Current Estimated Value
Home Financials for this Owner
Home Financials are based on the most recent Mortgage that was taken out on this home.
Original Mortgage
$314,000
Outstanding Balance
$269,922
Interest Rate
2.8%
Mortgage Type
New Conventional
Estimated Equity
$515,381
Purchase Details
Closed on
Dec 5, 2016
Sold by
Hall Aaron and Johnson Natalie
Bought by
Kanna Sai Shankar and Stover Katie Elizabeth
Home Financials for this Owner
Home Financials are based on the most recent Mortgage that was taken out on this home.
Original Mortgage
$353,250
Interest Rate
3.52%
Mortgage Type
New Conventional
Purchase Details
Closed on
Dec 11, 2015
Sold by
True Homes Llc
Bought by
Hall Aaron and Johnson Natalie
Purchase Details
Closed on
Nov 14, 2014
Sold by
Carolina Development Services Llc
Bought by
True Homes Llc
Create a Home Valuation Report for This Property
The Home Valuation Report is an in-depth analysis detailing your home's value as well as a comparison with similar homes in the area
Home Values in the Area
Average Home Value in this Area
Purchase History
| Date | Buyer | Sale Price | Title Company |
|---|---|---|---|
| Kanna Sai Shankar | -- | None Available | |
| Kanna Sai Shankar | $393,000 | None Available | |
| Hall Aaron | $399,000 | Independence Title Group | |
| True Homes Llc | $70,000 | Independence Title Group |
Source: Public Records
Mortgage History
| Date | Status | Borrower | Loan Amount |
|---|---|---|---|
| Open | Kanna Sai Shankar | $314,000 | |
| Closed | Kanna Sai Shankar | $353,250 |
Source: Public Records
Tax History Compared to Growth
Tax History
| Year | Tax Paid | Tax Assessment Tax Assessment Total Assessment is a certain percentage of the fair market value that is determined by local assessors to be the total taxable value of land and additions on the property. | Land | Improvement |
|---|---|---|---|---|
| 2025 | $4,768 | $702,300 | $0 | $0 |
| 2024 | $4,034 | $462,600 | $84,900 | $377,700 |
| 2023 | $3,869 | $462,600 | $84,900 | $377,700 |
| 2022 | $3,848 | $462,600 | $84,900 | $377,700 |
| 2021 | $3,845 | $462,600 | $84,900 | $377,700 |
| 2020 | $3,102 | $305,400 | $52,000 | $253,400 |
| 2019 | $3,088 | $305,400 | $52,000 | $253,400 |
| 2018 | $3,088 | $305,400 | $52,000 | $253,400 |
| 2017 | $3,414 | $326,300 | $52,000 | $274,300 |
| 2016 | $3,413 | $326,300 | $52,000 | $274,300 |
| 2015 | $542 | $326,300 | $52,000 | $274,300 |
| 2014 | -- | $0 | $0 | $0 |
Source: Public Records
Map
Nearby Homes
- 5054 Stonehill Ln
- 1441 Hammond Dr
- 2034 Laney Pond Rd
- 1024 Kensrowe Ln
- 1046 Serel Dr
- 2006 Laney Pond Rd
- 1348 Millbank Dr
- 1009 Murandy Ln
- 0000 Chestnut Ln
- 2020 Gable Way Ln
- 1314 Sarandon Dr
- 3109 Savannah Hills Dr
- 1115 Drummond Ln
- 2004 Viscount Dr
- 1103 Slate Ridge Rd
- 1464 Stonedown Ln
- 1000 Sarandon Dr
- 629 Gelderland Dr
- 4912 Potter Rd
- 220 Sugar Maple Ln
- 1102 Clover Ln
- 1104 Clover Ln Unit 62
- 1104 Clover Ln
- 1103 Clover Ln
- 5018 Stonehill Ln
- 5020 Stonehill Ln
- 3305 Privette Rd
- 1106 Clover Ln
- 5016 Stonehill Ln
- 5016 Stonehill Ln Unit 65
- 5024 Stonehill Ln Unit 68
- 5024 Stonehill Ln
- 1107 Clover Ln Unit 38
- 5026 Stonehill Ln Unit 69
- 5026 Stonehill Ln
- 5014 Stonehill Ln Unit 64
- 5014 Stonehill Ln
- 3315 Privette Rd
- 1108 Clover Ln Unit 60
- 5034 Stonehill Ln Unit 70