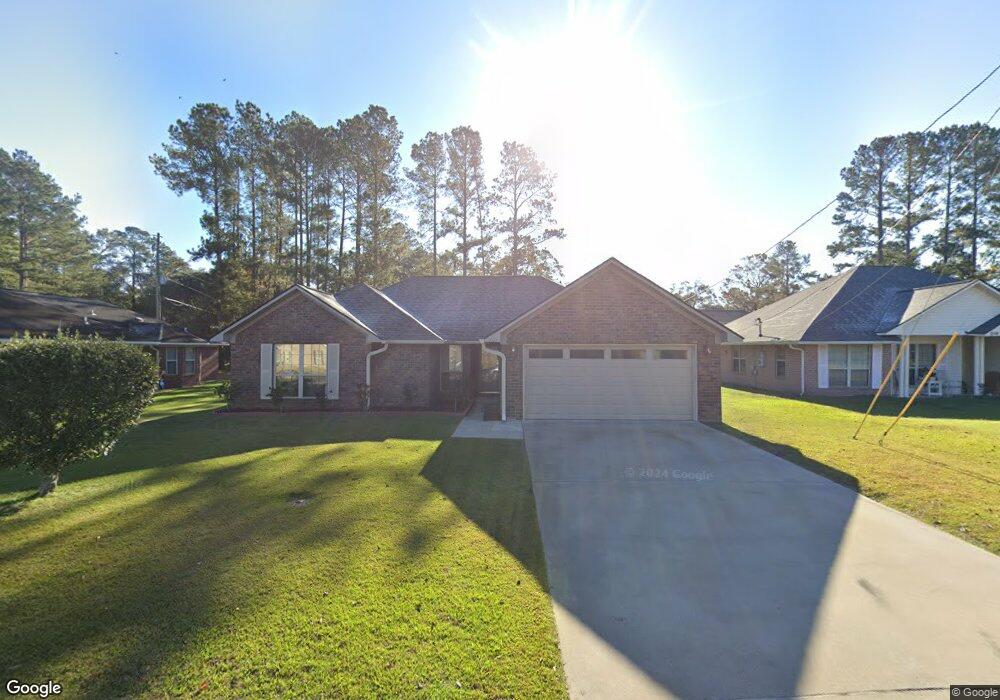
1102 Cornett Ct Hinesville, GA 31313
Estimated Value: $244,000 - $251,222
4
Beds
2
Baths
1,563
Sq Ft
$158/Sq Ft
Est. Value
About This Home
This home is located at 1102 Cornett Ct, Hinesville, GA 31313 and is currently estimated at $247,056, approximately $158 per square foot. 1102 Cornett Ct is a home located in Liberty County with nearby schools including Waldo Pafford Elementary School, Snelson-Golden Middle School, and Bradwell Institute.
Ownership History
Date
Name
Owned For
Owner Type
Purchase Details
Closed on
Jan 26, 2017
Sold by
Hollingsworth Cleo
Bought by
Hollingsworth Cleo and Hollingsworth Freddie D
Current Estimated Value
Home Financials for this Owner
Home Financials are based on the most recent Mortgage that was taken out on this home.
Original Mortgage
$106,700
Outstanding Balance
$71,787
Interest Rate
4.32%
Mortgage Type
VA
Estimated Equity
$175,269
Purchase Details
Closed on
Jun 14, 2006
Sold by
Hollingsworth Freddie D
Bought by
Hollingsworth Freddie D and Hollingsworth Cleo
Purchase Details
Closed on
Oct 27, 2005
Sold by
Dryden Enterprises Inc
Bought by
Hollingsworth Freddie D and Hollingsworth Hollingworth Cleo
Home Financials for this Owner
Home Financials are based on the most recent Mortgage that was taken out on this home.
Original Mortgage
$129,730
Interest Rate
5.84%
Mortgage Type
VA
Create a Home Valuation Report for This Property
The Home Valuation Report is an in-depth analysis detailing your home's value as well as a comparison with similar homes in the area
Home Values in the Area
Average Home Value in this Area
Purchase History
| Date | Buyer | Sale Price | Title Company |
|---|---|---|---|
| Hollingsworth Cleo | -- | -- | |
| Hollingsworth Freddie D | -- | -- | |
| Hollingsworth Freddie D | $127,000 | -- |
Source: Public Records
Mortgage History
| Date | Status | Borrower | Loan Amount |
|---|---|---|---|
| Open | Hollingsworth Cleo | $106,700 | |
| Previous Owner | Hollingsworth Freddie D | $129,730 |
Source: Public Records
Tax History Compared to Growth
Tax History
| Year | Tax Paid | Tax Assessment Tax Assessment Total Assessment is a certain percentage of the fair market value that is determined by local assessors to be the total taxable value of land and additions on the property. | Land | Improvement |
|---|---|---|---|---|
| 2024 | $23 | $88,598 | $12,000 | $76,598 |
| 2023 | $23 | $79,667 | $12,000 | $67,667 |
| 2022 | $3,106 | $66,758 | $9,600 | $57,158 |
| 2021 | $2,655 | $55,977 | $9,600 | $46,377 |
| 2020 | $2,474 | $51,639 | $7,200 | $44,439 |
| 2019 | $2,479 | $52,142 | $7,200 | $44,942 |
| 2018 | $2,371 | $50,120 | $7,200 | $42,920 |
| 2017 | $1,666 | $50,594 | $7,200 | $43,394 |
| 2016 | $2,301 | $51,068 | $7,200 | $43,868 |
| 2015 | $2,681 | $56,447 | $10,000 | $46,447 |
| 2014 | $2,681 | $58,921 | $10,000 | $48,921 |
| 2013 | -- | $54,664 | $10,000 | $44,664 |
Source: Public Records
Map
Nearby Homes
- 1112 Cornett Ct
- 1117 Cornett Ct
- 14.96 Ac Ellie Ln
- 1072 Ricade Dr
- 1103 Ricade Dr
- 950 Elma G Miles Pkwy
- 1100 Pineland Ave Unit 2D
- 1091 Kelly Dr
- 1106 Ricade Dr
- 951 Elma G Miles Pkwy
- 1.05 AC Elma G Miles Pkwy
- 823 Elma G Miles Pkwy
- 1.09 AC Elma G Miles Pkwy
- .58 AC Elma G Miles Pkwy
- 970 Whippoorwill Way
- 0 Elma G Miles Pkwy Unit 324139
- 253 Glenn Bryant Rd
- 979B Pineland Ave Unit B
- 979B Pineland Ave
- 144 Alcott Cir
- 1104 Cornett Ct
- 911 Amanda Ln
- 909 Granger Dr
- 911 Granger Dr
- 1106 Cornett Ct
- 1103 Cornett Ct Unit 57
- 1103 Cornett Ct
- 1105 Cornett Ct
- 907 Granger Dr
- 913 Granger Dr
- 1107 Cornett Ct
- 1108 Cornett Ct
- 910 Amanda Ln
- 1000 Canton Ct
- 0 Granger Dr Unit 7247470
- 915 Amanda Ln
- 905 Granger Dr
- 915 Granger Dr
- 905 Amanda Ln
- 1302 Brentwood Dr