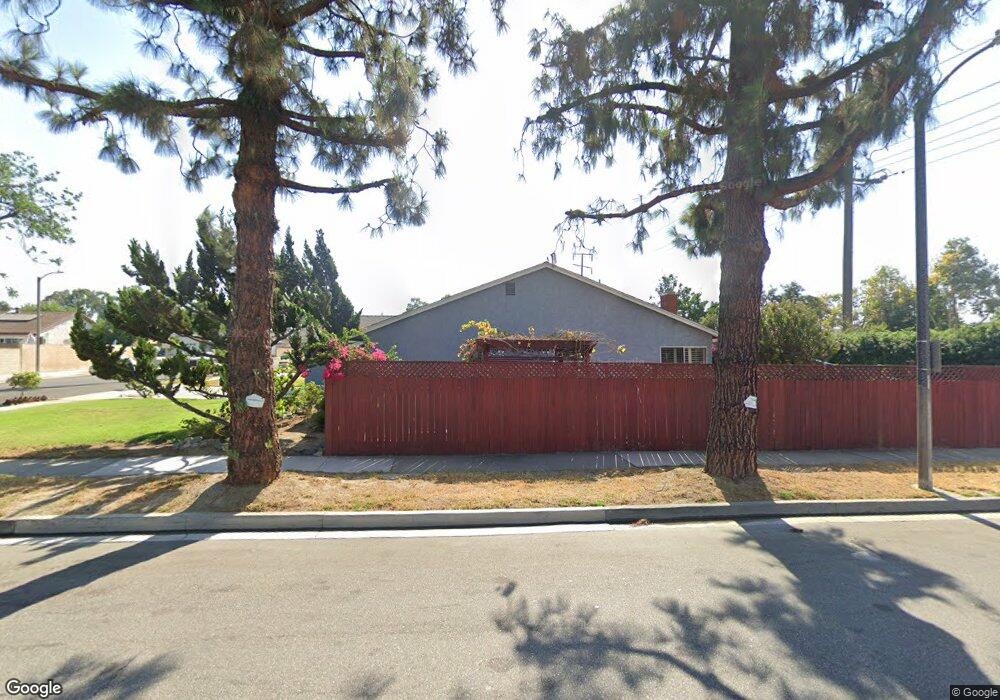
1102 E Cherry Hill St Ontario, CA 91761
Downtown Ontario NeighborhoodEstimated Value: $668,000 - $715,000
3
Beds
2
Baths
1,370
Sq Ft
$506/Sq Ft
Est. Value
About This Home
This home is located at 1102 E Cherry Hill St, Ontario, CA 91761 and is currently estimated at $692,548, approximately $505 per square foot. 1102 E Cherry Hill St is a home located in San Bernardino County with nearby schools including Bon View Elementary, De Anza Middle, and Ontario High School.
Ownership History
Date
Name
Owned For
Owner Type
Purchase Details
Closed on
Jul 16, 2003
Sold by
The Rogers Family Trust
Bought by
Ramirez Michelle M
Current Estimated Value
Home Financials for this Owner
Home Financials are based on the most recent Mortgage that was taken out on this home.
Original Mortgage
$187,600
Interest Rate
4.5%
Mortgage Type
Purchase Money Mortgage
Purchase Details
Closed on
Nov 29, 1993
Sold by
Rogers Carl T
Bought by
Rogers Carl T and Rogers Wanda
Create a Home Valuation Report for This Property
The Home Valuation Report is an in-depth analysis detailing your home's value as well as a comparison with similar homes in the area
Home Values in the Area
Average Home Value in this Area
Purchase History
| Date | Buyer | Sale Price | Title Company |
|---|---|---|---|
| Ramirez Michelle M | $234,500 | First American | |
| Rogers Carl T | -- | -- |
Source: Public Records
Mortgage History
| Date | Status | Borrower | Loan Amount |
|---|---|---|---|
| Previous Owner | Ramirez Michelle M | $187,600 | |
| Closed | Ramirez Michelle M | $23,450 |
Source: Public Records
Tax History
| Year | Tax Paid | Tax Assessment Tax Assessment Total Assessment is a certain percentage of the fair market value that is determined by local assessors to be the total taxable value of land and additions on the property. | Land | Improvement |
|---|---|---|---|---|
| 2025 | $3,721 | $333,411 | $116,694 | $216,717 |
| 2024 | $3,638 | $326,874 | $114,406 | $212,468 |
| 2023 | $3,537 | $320,465 | $112,163 | $208,302 |
| 2022 | $3,492 | $314,182 | $109,964 | $204,218 |
| 2021 | $3,470 | $308,022 | $107,808 | $200,214 |
| 2020 | $3,410 | $304,864 | $106,703 | $198,161 |
| 2019 | $3,382 | $298,886 | $104,611 | $194,275 |
| 2018 | $3,336 | $293,026 | $102,560 | $190,466 |
| 2017 | $3,218 | $287,280 | $100,549 | $186,731 |
| 2016 | $3,093 | $281,647 | $98,577 | $183,070 |
| 2015 | $3,073 | $277,416 | $97,096 | $180,320 |
| 2014 | $2,980 | $271,982 | $95,194 | $176,788 |
Source: Public Records
Map
Nearby Homes
- 2431 S Marigold Place
- 2425 S Bon View Ave
- 4315 S Grasly Paseo
- 1528 1538 W Holt
- 1305 W North Pinecrest
- 2601 S Mildred Place
- 2413 S Parco Ave
- 1426 E Tam o Shanter St
- 2424 S Lake Ave
- 1456 E Philadelphia St Unit 134
- 1456 E Philadelphia St Unit 378
- 1456 E Philadelphia St Unit 89
- 1456 E Philadelphia St Unit 275
- 1456 E Philadelphia St Unit 359
- 1456 E Philadelphia St Unit 279
- 1456 E Philadelphia St Unit 372
- 1456 E Philadelphia St Unit 41
- 1456 E Philadelphia St Unit 245
- 1456 E Philadelphia St Unit 158
- 1456 E Philadelphia St Unit 154
- 1108 E Cherry Hill St
- 1114 E Cherry Hill St
- 2533 S Cucamonga Ave
- 2550 S Cucamonga Ave
- 2544 S Cucamonga Ave
- 2601 S Cucamonga Ave
- 2534 S Raymond Place
- 2538 S Cucamonga Ave
- 1120 E Cherry Hill St
- 2527 S Cucamonga Ave
- 1113 E Bermuda Dunes St
- 2602 S Cucamonga Ave
- 2607 S Cucamonga Ave
- 2528 S Raymond Place
- 2532 S Cucamonga Ave
- 2545 S Holmes Place
- 2539 S Holmes Place
- 1119 E Bermuda Dunes St
- 2533 S Holmes Place
- 2608 S Cucamonga Ave
Your Personal Tour Guide
Ask me questions while you tour the home.