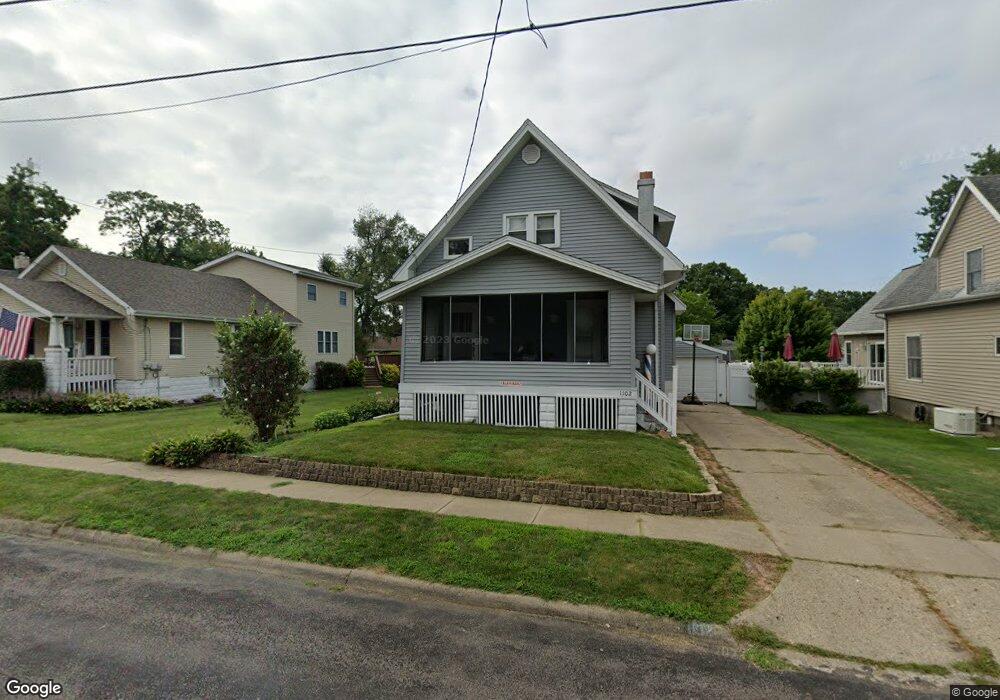
1102 E Hines Ave Peoria Heights, IL 61616
Estimated Value: $113,000 - $140,817
3
Beds
2
Baths
1,751
Sq Ft
$71/Sq Ft
Est. Value
About This Home
This home is located at 1102 E Hines Ave, Peoria Heights, IL 61616 and is currently estimated at $124,454, approximately $71 per square foot. 1102 E Hines Ave is a home located in Peoria County with nearby schools including Peoria Heights Grade School, Peoria Heights High School, and St Thomas Catholic School.
Ownership History
Date
Name
Owned For
Owner Type
Purchase Details
Closed on
Nov 16, 2023
Sold by
Horstmann Thomas and Horstmann Nancy
Bought by
Slizewski Joshua G and Martin Brittany M
Current Estimated Value
Home Financials for this Owner
Home Financials are based on the most recent Mortgage that was taken out on this home.
Original Mortgage
$9,400
Interest Rate
7.8%
Mortgage Type
New Conventional
Purchase Details
Closed on
Nov 6, 2023
Sold by
Horstmann Thomas and Horstmann Nancy
Bought by
Slizewski Joshua G and Martin Brittany M
Home Financials for this Owner
Home Financials are based on the most recent Mortgage that was taken out on this home.
Original Mortgage
$9,400
Interest Rate
7.8%
Mortgage Type
New Conventional
Purchase Details
Closed on
Nov 23, 2015
Sold by
Perdue Glenn E
Bought by
Horstmann Thomas and Horstmann Nancy J
Create a Home Valuation Report for This Property
The Home Valuation Report is an in-depth analysis detailing your home's value as well as a comparison with similar homes in the area
Home Values in the Area
Average Home Value in this Area
Purchase History
| Date | Buyer | Sale Price | Title Company |
|---|---|---|---|
| Slizewski Joshua G | $94,000 | None Listed On Document | |
| Slizewski Joshua G | $94,000 | None Listed On Document | |
| Horstmann Thomas | $55,000 | Attorney Only |
Source: Public Records
Mortgage History
| Date | Status | Borrower | Loan Amount |
|---|---|---|---|
| Closed | Slizewski Joshua G | $9,400 | |
| Open | Slizewski Joshua G | $86,080 | |
| Closed | Slizewski Joshua G | $86,080 |
Source: Public Records
Tax History Compared to Growth
Tax History
| Year | Tax Paid | Tax Assessment Tax Assessment Total Assessment is a certain percentage of the fair market value that is determined by local assessors to be the total taxable value of land and additions on the property. | Land | Improvement |
|---|---|---|---|---|
| 2024 | $2,200 | $31,760 | $4,120 | $27,640 |
| 2023 | $2,611 | $29,140 | $3,780 | $25,360 |
| 2022 | $1,692 | $18,440 | $3,960 | $14,480 |
| 2021 | $1,640 | $17,560 | $3,770 | $13,790 |
| 2020 | $1,676 | $17,220 | $3,700 | $13,520 |
| 2019 | $1,669 | $17,220 | $3,700 | $13,520 |
| 2018 | $1,660 | $17,230 | $3,490 | $13,740 |
| 2017 | $1,734 | $18,120 | $3,670 | $14,450 |
| 2016 | -- | $25,360 | $3,670 | $21,690 |
| 2015 | -- | $25,360 | $3,670 | $21,690 |
| 2014 | $21 | $25,970 | $3,530 | $22,440 |
| 2013 | $21 | $26,100 | $3,550 | $22,550 |
Source: Public Records
Map
Nearby Homes
- 4100 N Illinois Ave
- 1216 E Rouse Ave
- 903 E Lake Ave
- 810 E Sciota Ave
- 0 E Moneta Ave
- 4012 N Boulevard Ave
- 1015 E Moneta Ave
- 1224 E Moneta Ave
- 1219 E Moneta Ave
- 4021 N Boulevard Ave
- 621 E Sciota Ave
- 3915 N Dayton Ave
- 3718 N Ashton Ave
- 1404 E Moneta Ave
- 512 E Paris Ave
- 801 E Toledo Ave
- 1012 E Paris Ave
- 3824 N Dayton Ave
- 513 E Moneta Ave
- 1310 E Samuel Ave Unit 3F
- 1106 E Hines Ave
- 1018 E Hines Ave
- 1108 E Hines Ave
- 1014 E Hines Ave
- 1101 E Hazard Ave
- 1101 E Hazard Ave Unit A&B
- 1103 E Hazard Ave
- 1110 E Hines Ave
- 1019 E Hazard Ave
- 1010 E Hines Ave
- 1107 E Hazard Ave
- 1017 E Hazard Ave
- 1006 E Hines Ave
- 1114 E Hines Ave
- 1103 E Hines Ave
- 1101 E Hines Ave
- 1013 E Hazard Ave
- 1111 E Hazard Ave Unit 4
- 1109 E Hines Ave
- 1019 E Hines Ave