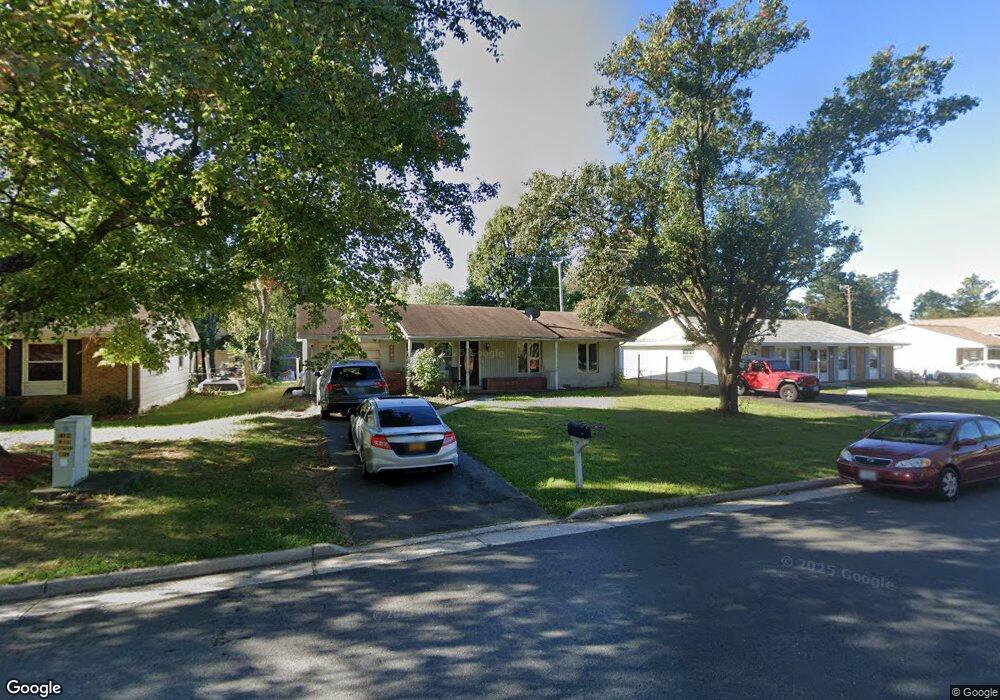
1102 E Maple Ave Sterling, VA 20164
Estimated Value: $538,000 - $584,000
3
Beds
2
Baths
1,200
Sq Ft
$467/Sq Ft
Est. Value
About This Home
This home is located at 1102 E Maple Ave, Sterling, VA 20164 and is currently estimated at $560,672, approximately $467 per square foot. 1102 E Maple Ave is a home located in Loudoun County with nearby schools including Sully Elementary School, Sterling Middle School, and Park View High School.
Ownership History
Date
Name
Owned For
Owner Type
Purchase Details
Closed on
Sep 29, 2004
Sold by
Morris Kevin A
Bought by
Reyes Rudy B
Current Estimated Value
Home Financials for this Owner
Home Financials are based on the most recent Mortgage that was taken out on this home.
Original Mortgage
$146,080
Outstanding Balance
$72,540
Interest Rate
5.81%
Mortgage Type
New Conventional
Estimated Equity
$488,132
Purchase Details
Closed on
Mar 2, 2000
Sold by
Peters Kenneth
Bought by
Morris Kevin A
Home Financials for this Owner
Home Financials are based on the most recent Mortgage that was taken out on this home.
Original Mortgage
$129,375
Interest Rate
8.23%
Purchase Details
Closed on
Mar 23, 1995
Sold by
Stanton Thomas J
Bought by
Peters Kenneth S
Home Financials for this Owner
Home Financials are based on the most recent Mortgage that was taken out on this home.
Original Mortgage
$106,219
Interest Rate
8.78%
Purchase Details
Closed on
Aug 2, 1994
Sold by
Bi Helfinstein
Bought by
Stanton Thomas J
Create a Home Valuation Report for This Property
The Home Valuation Report is an in-depth analysis detailing your home's value as well as a comparison with similar homes in the area
Home Values in the Area
Average Home Value in this Area
Purchase History
| Date | Buyer | Sale Price | Title Company |
|---|---|---|---|
| Reyes Rudy B | $194,774 | -- | |
| Morris Kevin A | $155,500 | -- | |
| Peters Kenneth S | $145,000 | -- | |
| Stanton Thomas J | $107,047 | -- |
Source: Public Records
Mortgage History
| Date | Status | Borrower | Loan Amount |
|---|---|---|---|
| Open | Reyes Rudy B | $146,080 | |
| Previous Owner | Morris Kevin A | $129,375 | |
| Previous Owner | Stanton Thomas J | $106,219 | |
| Closed | Stanton Thomas J | $28,000 |
Source: Public Records
Tax History
| Year | Tax Paid | Tax Assessment Tax Assessment Total Assessment is a certain percentage of the fair market value that is determined by local assessors to be the total taxable value of land and additions on the property. | Land | Improvement |
|---|---|---|---|---|
| 2025 | $4,176 | $518,700 | $233,800 | $284,900 |
| 2024 | $4,374 | $505,690 | $208,800 | $296,890 |
| 2023 | $3,954 | $451,920 | $208,800 | $243,120 |
| 2022 | $3,889 | $436,980 | $188,800 | $248,180 |
| 2021 | $3,864 | $394,260 | $178,800 | $215,460 |
| 2020 | $3,806 | $367,700 | $153,800 | $213,900 |
| 2019 | $3,617 | $346,150 | $153,800 | $192,350 |
| 2018 | $3,534 | $325,670 | $138,800 | $186,870 |
| 2017 | $3,477 | $309,040 | $138,800 | $170,240 |
| 2016 | $3,438 | $300,220 | $0 | $0 |
| 2015 | $3,149 | $157,130 | $0 | $157,130 |
| 2014 | $3,097 | $147,880 | $0 | $147,880 |
Source: Public Records
Map
Nearby Homes
- 503 S Maple Ct
- 101 S Harrison Rd
- 1201 E Holly Ave
- 229 Applegate Dr
- 113 Caragana Ct
- 1314 E Holly Ave
- 703 E Dickenson Ct
- 141 N Fillmore Ave Unit 10
- 1540 Powells Tavern Place
- 12815 Briery River Terrace
- 221 N Emory Dr Unit 8
- 12807 Scranton Ct
- 1118 S Williamsburg Ct
- 308 E Cornell Dr
- 112 N Kennedy Rd
- 1543 Youngs Point Place
- 204 Elizabeth Ct
- 122 Briarwood Ct
- 1731 Whitewood Ln
- 117 W Concord Ct
- 1100 E Maple Ave
- 1104 E Maple Ave
- 501 Buckthorn Ct
- 502 Buckthorn Ct
- 1022 E Maple Ave
- 504 S Garfield Rd
- 504 S Garfield Rd
- 507 S Maple Ct
- 1020 E Maple Ave
- 1108 E Maple Ave
- 503 Buckthorn Ct
- 500 Buckthorn Ct
- 302 Linden Ct
- 502 S Garfield Rd
- 503 S Garfield Rd
- 505 S Maple Ct
- 1110 E Maple Ave
- 303 Linden Ct
- 1018 E Maple Ave
- 504 S Maple Ct
Your Personal Tour Guide
Ask me questions while you tour the home.