Estimated Value: $94,000 - $127,833
3
Beds
1
Bath
888
Sq Ft
$119/Sq Ft
Est. Value
About This Home
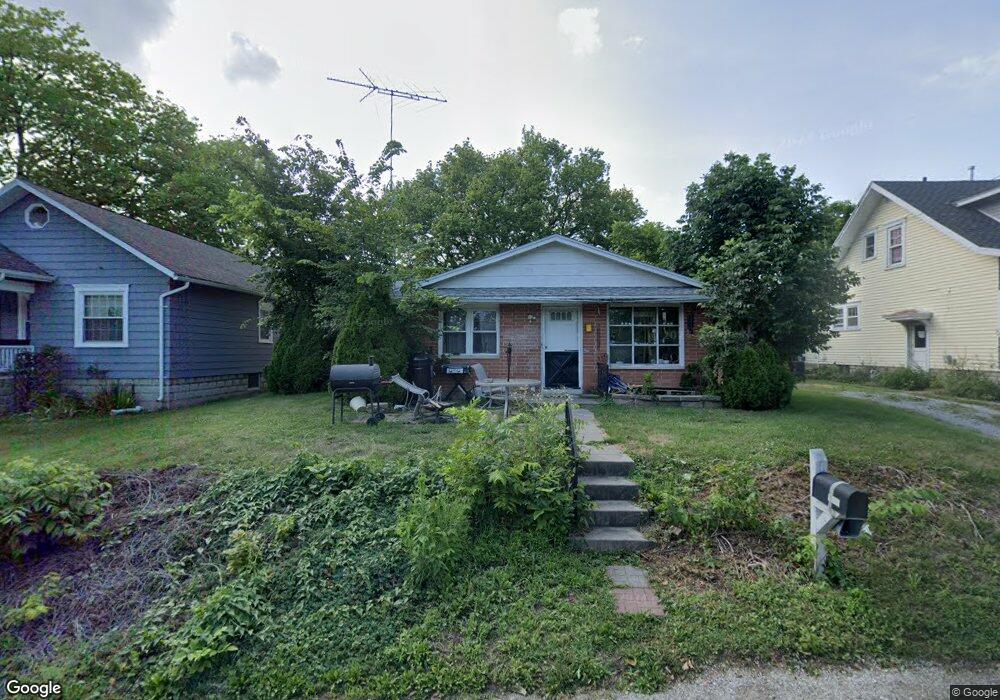
This home is located at 1102 Fountain Blvd, Piqua, OH 45356 and is currently estimated at $105,958, approximately $119 per square foot. 1102 Fountain Blvd is a home located in Miami County with nearby schools including Washington Primary School, Piqua Junior High School, and Piqua High School.
Ownership History
Date
Name
Owned For
Owner Type
Purchase Details
Closed on
Jul 18, 2025
Sold by
Ary Jason D
Bought by
Ohio H & M Solution Llc
Current Estimated Value
Home Financials for this Owner
Home Financials are based on the most recent Mortgage that was taken out on this home.
Original Mortgage
$95,000
Outstanding Balance
$79,626
Interest Rate
7.04%
Mortgage Type
Construction
Estimated Equity
$26,332
Purchase Details
Closed on
Jul 31, 2012
Sold by
Grise Robert O and Grise Ronald E
Bought by
Ary Jason D
Home Financials for this Owner
Home Financials are based on the most recent Mortgage that was taken out on this home.
Original Mortgage
$65,900
Interest Rate
3.65%
Mortgage Type
VA
Purchase Details
Closed on
Nov 22, 2011
Sold by
Grise Robert O
Bought by
Grise Robert O and Heening Carolyn M
Purchase Details
Closed on
Nov 17, 2011
Sold by
Grise Robert O
Bought by
Grise Robert O and Heening Carolyn M
Purchase Details
Closed on
Jan 1, 1990
Bought by
Grise Robt O
Create a Home Valuation Report for This Property
The Home Valuation Report is an in-depth analysis detailing your home's value as well as a comparison with similar homes in the area
Home Values in the Area
Average Home Value in this Area
Purchase History
| Date | Buyer | Sale Price | Title Company |
|---|---|---|---|
| Ohio H & M Solution Llc | $95,000 | Gemini Title Company | |
| Ary Jason D | $65,900 | Sterling Land Title North Ll | |
| Grise Robert O | -- | -- | |
| Grise Robert O | -- | -- | |
| Grise Robt O | -- | -- |
Source: Public Records
Mortgage History
| Date | Status | Borrower | Loan Amount |
|---|---|---|---|
| Open | Ohio H & M Solution Llc | $95,000 | |
| Previous Owner | Ary Jason D | $65,900 |
Source: Public Records
Tax History Compared to Growth
Tax History
| Year | Tax Paid | Tax Assessment Tax Assessment Total Assessment is a certain percentage of the fair market value that is determined by local assessors to be the total taxable value of land and additions on the property. | Land | Improvement |
|---|---|---|---|---|
| 2024 | $1,187 | $28,880 | $7,040 | $21,840 |
| 2023 | $1,187 | $28,880 | $7,040 | $21,840 |
| 2022 | $1,207 | $28,880 | $7,040 | $21,840 |
| 2021 | $1,149 | $25,140 | $6,130 | $19,010 |
| 2020 | $1,126 | $25,140 | $6,130 | $19,010 |
| 2019 | $1,132 | $25,140 | $6,130 | $19,010 |
| 2018 | $1,036 | $21,950 | $6,130 | $15,820 |
| 2017 | $1,048 | $21,950 | $6,130 | $15,820 |
| 2016 | $1,037 | $21,950 | $6,130 | $15,820 |
| 2015 | $1,061 | $21,950 | $6,130 | $15,820 |
| 2014 | $1,061 | $21,950 | $6,130 | $15,820 |
| 2013 | $1,064 | $21,950 | $6,130 | $15,820 |
Source: Public Records
Map
Nearby Homes
- 1100 Fountain Blvd
- 1104 Fountain Blvd
- 1106 Fountain Blvd
- 1103 Echo Lake Dr
- 1100 Lake St
- 1130 Echo Lake Dr
- 1102 Lake St
- 1107 Echo Lake Dr
- 1106 Lake St
- 1111 Echo Lake Dr
- 0 Echo Lake Dr
- 1 Echo Lake Dr
- 1115 Echo Lake Dr
- 1110 Lake St
- 1105 Lake St
- 1112 Lake St
- 1000 Echo Lake Dr
- 1202 Fountain Blvd
- 1107 Lake St
- 1114 Lake St