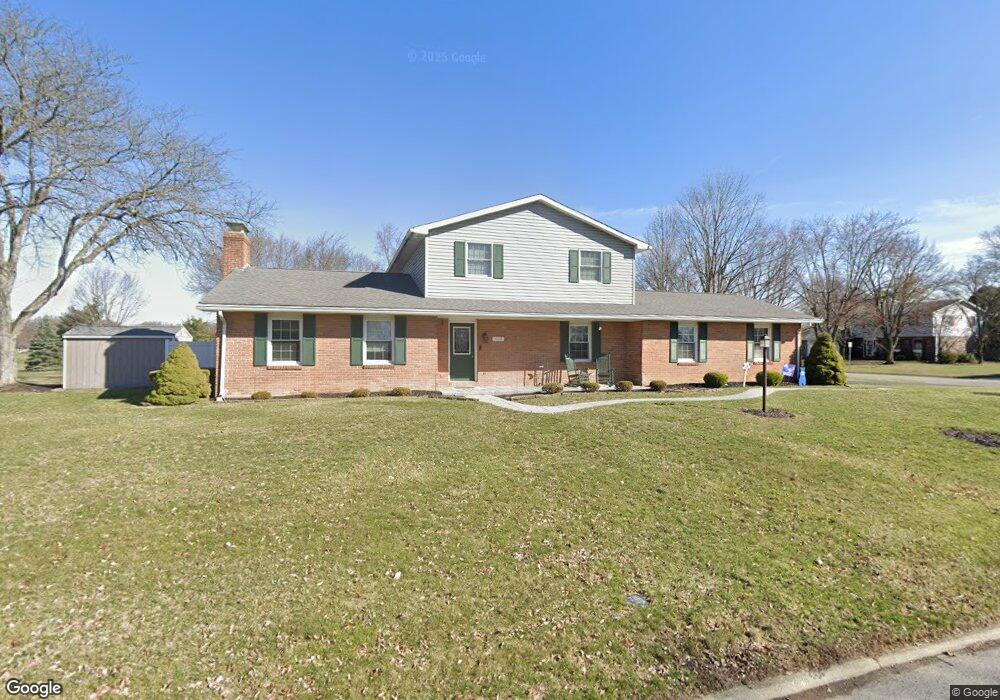
1102 Inverness Dr Findlay, OH 45840
Estimated Value: $305,867 - $372,000
3
Beds
3
Baths
2,020
Sq Ft
$165/Sq Ft
Est. Value
About This Home
This home is located at 1102 Inverness Dr, Findlay, OH 45840 and is currently estimated at $332,467, approximately $164 per square foot. 1102 Inverness Dr is a home located in Hancock County with nearby schools including Liberty-Benton Elementary School, Liberty-Benton Middle School, and Liberty-Benton High School.
Ownership History
Date
Name
Owned For
Owner Type
Purchase Details
Closed on
Sep 15, 2011
Sold by
Click Jessica K
Bought by
Click Scott M
Current Estimated Value
Purchase Details
Closed on
Jun 8, 2010
Sold by
Relocation Properties Management Llc
Bought by
Click Scott M and Click Jessica K
Home Financials for this Owner
Home Financials are based on the most recent Mortgage that was taken out on this home.
Original Mortgage
$163,794
Outstanding Balance
$109,235
Interest Rate
4.87%
Mortgage Type
FHA
Estimated Equity
$223,232
Purchase Details
Closed on
Jul 17, 2009
Sold by
Mace James D and Mace Erin L
Bought by
Schulze Andrew J and Schulze Rachel M
Home Financials for this Owner
Home Financials are based on the most recent Mortgage that was taken out on this home.
Original Mortgage
$159,065
Interest Rate
5.49%
Mortgage Type
FHA
Purchase Details
Closed on
Jun 9, 2005
Sold by
Simoni William R and Simoni Maureen T
Bought by
Mace James D and Mace Erin L
Home Financials for this Owner
Home Financials are based on the most recent Mortgage that was taken out on this home.
Original Mortgage
$143,920
Interest Rate
5.82%
Mortgage Type
Purchase Money Mortgage
Purchase Details
Closed on
Mar 10, 1994
Bought by
Flick Edwin M and Flick Ethelyn M
Create a Home Valuation Report for This Property
The Home Valuation Report is an in-depth analysis detailing your home's value as well as a comparison with similar homes in the area
Home Values in the Area
Average Home Value in this Area
Purchase History
| Date | Buyer | Sale Price | Title Company |
|---|---|---|---|
| Click Scott M | -- | Mid Am Title Agency | |
| Click Scott M | $166,000 | Mid Am Title Agency | |
| Schulze Andrew J | $162,000 | Mid Am Title Agency | |
| Mace James D | $179,900 | Mid Am Title | |
| Flick Edwin M | -- | -- |
Source: Public Records
Mortgage History
| Date | Status | Borrower | Loan Amount |
|---|---|---|---|
| Open | Click Scott M | $163,794 | |
| Previous Owner | Schulze Andrew J | $159,065 | |
| Previous Owner | Mace James D | $143,920 |
Source: Public Records
Tax History Compared to Growth
Tax History
| Year | Tax Paid | Tax Assessment Tax Assessment Total Assessment is a certain percentage of the fair market value that is determined by local assessors to be the total taxable value of land and additions on the property. | Land | Improvement |
|---|---|---|---|---|
| 2024 | $2,946 | $79,250 | $11,340 | $67,910 |
| 2023 | $2,876 | $79,250 | $11,340 | $67,910 |
| 2022 | $2,848 | $79,250 | $11,340 | $67,910 |
| 2021 | $2,624 | $64,460 | $11,360 | $53,100 |
| 2020 | $2,647 | $64,460 | $11,360 | $53,100 |
| 2019 | $2,539 | $64,460 | $11,360 | $53,100 |
| 2018 | $2,001 | $56,060 | $9,880 | $46,180 |
| 2017 | $2,064 | $56,060 | $9,880 | $46,180 |
| 2016 | $2,008 | $56,060 | $9,880 | $46,180 |
| 2015 | $1,965 | $53,670 | $9,880 | $43,790 |
| 2014 | $1,983 | $53,670 | $9,880 | $43,790 |
| 2012 | $2,072 | $53,670 | $9,880 | $43,790 |
Source: Public Records
Map
Nearby Homes
- 3018 Gleneagle Dr
- 933 Laurel Ln
- 3106 Saddlebrook
- 1405 Cypress Lake
- 1310 Muirfield Dr
- 6535 Silver Lake Dr
- 925 W Melrose Ave
- 905 W Melrose Ave
- 615 Hillcrest Ave
- 3300 Crosshill Dr
- 506 Hillcrest Ave
- 643 Edith Ave
- 0 County Road 95 Unit 6097574
- 0 Township Highway 99
- 12325 Township Highway 99
- 126 Hillcrest Ave
- 0 County Road 140
- 0 Allen Township 142
- 0 Bushwillow Dr Or Rock Candy Rd Unit Lot 157
- 0 County Road 223
- 2906 Saint Andrews Dr
- 1112 Inverness Dr
- 1101 Inverness Dr
- 1107 Inverness Dr
- 2912 Saint Andrews Dr
- 1020 Inverness Dr
- 2907 Saint Andrews Dr
- 1115 Inverness Dr
- 1118 Inverness Dr
- 2811 Saint Andrews Dr
- 2915 Saint Andrews Dr
- 2918 Saint Andrews Dr
- 1121 Inverness Dr
- 1100 W Bigelow Ave
- 1106 W Bigelow Ave
- 1015 Inverness Dr
- 1006 Inverness Dr
- 1124 Inverness Dr
- 1112 W Bigelow Ave
- 2805 Saint Andrews Dr