Estimated Value: $119,000 - $145,000
3
Beds
1
Bath
975
Sq Ft
$137/Sq Ft
Est. Value
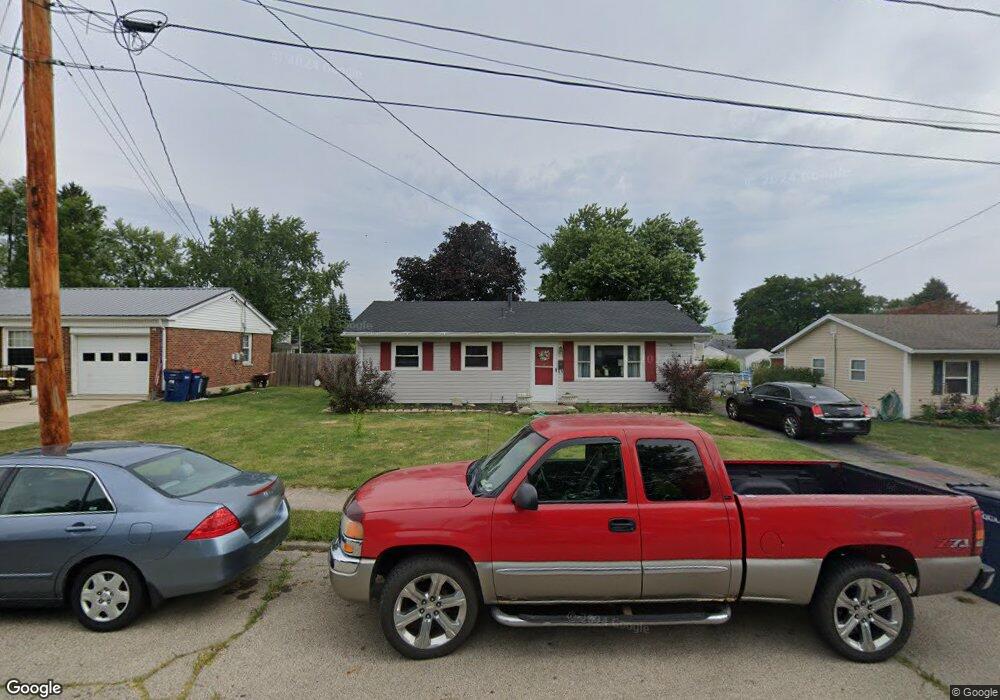
About This Home
This home is located at 1102 Martz Dr, Piqua, OH 45356 and is currently estimated at $133,488, approximately $136 per square foot. 1102 Martz Dr is a home located in Miami County with nearby schools including Piqua Junior High School, Piqua High School, and Nicholas School.
Ownership History
Date
Name
Owned For
Owner Type
Purchase Details
Closed on
Jun 20, 2019
Sold by
Eichelberger Christine Nicole
Bought by
Eichelberger Christine Nicole and Eichelberger Michael
Current Estimated Value
Purchase Details
Closed on
May 20, 2016
Sold by
Eichelberger Michael A and Eichelberger Joyce A
Bought by
Eichelberger Christine Nicole
Home Financials for this Owner
Home Financials are based on the most recent Mortgage that was taken out on this home.
Original Mortgage
$54,054
Outstanding Balance
$44,169
Interest Rate
4.5%
Mortgage Type
FHA
Estimated Equity
$89,319
Purchase Details
Closed on
Aug 2, 1990
Bought by
Eichelberger Michael A
Create a Home Valuation Report for This Property
The Home Valuation Report is an in-depth analysis detailing your home's value as well as a comparison with similar homes in the area
Home Values in the Area
Average Home Value in this Area
Purchase History
| Date | Buyer | Sale Price | Title Company |
|---|---|---|---|
| Eichelberger Christine Nicole | -- | None Available | |
| Eichelberger Christine Nicole | $62,500 | Attorney | |
| Eichelberger Michael A | $36,000 | -- |
Source: Public Records
Mortgage History
| Date | Status | Borrower | Loan Amount |
|---|---|---|---|
| Open | Eichelberger Christine Nicole | $54,054 |
Source: Public Records
Tax History
| Year | Tax Paid | Tax Assessment Tax Assessment Total Assessment is a certain percentage of the fair market value that is determined by local assessors to be the total taxable value of land and additions on the property. | Land | Improvement |
|---|---|---|---|---|
| 2024 | $1,423 | $28,920 | $6,760 | $22,160 |
| 2023 | $1,188 | $28,920 | $6,760 | $22,160 |
| 2022 | $1,209 | $28,920 | $6,760 | $22,160 |
| 2021 | $980 | $21,430 | $5,010 | $16,420 |
| 2020 | $960 | $21,430 | $5,010 | $16,420 |
| 2019 | $965 | $21,430 | $5,010 | $16,420 |
| 2018 | $948 | $20,090 | $5,040 | $15,050 |
| 2017 | $959 | $20,090 | $5,040 | $15,050 |
| 2016 | $976 | $20,090 | $5,040 | $15,050 |
| 2015 | $959 | $19,290 | $4,830 | $14,460 |
| 2014 | $959 | $19,290 | $4,830 | $14,460 |
| 2013 | $962 | $19,290 | $4,830 | $14,460 |
Source: Public Records
Map
Nearby Homes
Your Personal Tour Guide
Ask me questions while you tour the home.