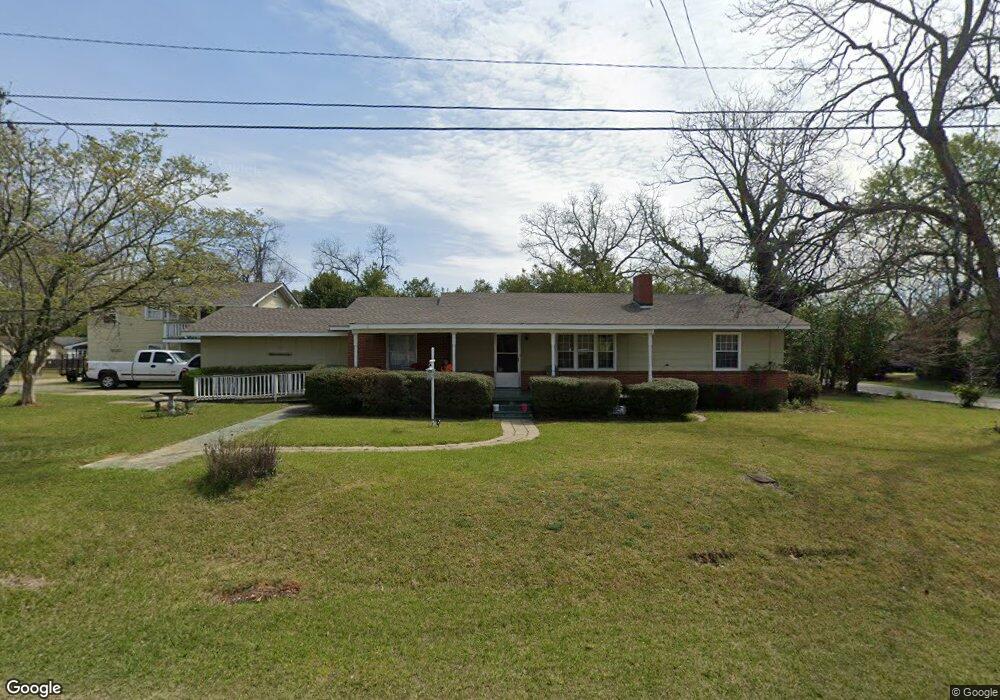
1102 N 3rd St Cordele, GA 31015
Estimated Value: $218,000 - $269,000
2
Beds
2
Baths
960
Sq Ft
$252/Sq Ft
Est. Value
About This Home
This home is located at 1102 N 3rd St, Cordele, GA 31015 and is currently estimated at $241,992, approximately $252 per square foot. 1102 N 3rd St is a home located in Crisp County with nearby schools including Crisp County Elementary School, Crisp County Primary School, and Crisp County Middle School.
Ownership History
Date
Name
Owned For
Owner Type
Purchase Details
Closed on
Jan 28, 2025
Sold by
Peavy Properties Cordele Llc
Bought by
Cnp Renovations Llc
Current Estimated Value
Home Financials for this Owner
Home Financials are based on the most recent Mortgage that was taken out on this home.
Original Mortgage
$159,715
Outstanding Balance
$27,389
Interest Rate
6.91%
Mortgage Type
New Conventional
Estimated Equity
$214,603
Purchase Details
Closed on
Oct 31, 2016
Sold by
John L
Bought by
Peavy Properties Cordele Llc
Purchase Details
Closed on
Sep 11, 2015
Sold by
Gurley Mary Kate Yawn
Bought by
Peavy John L and Peavy Tony E
Purchase Details
Closed on
Jan 3, 2013
Sold by
Yawn Maude Stalvey
Bought by
Gurley Mary Kate Yawn
Purchase Details
Closed on
Apr 12, 1999
Sold by
Yawn Charles
Bought by
Yawn Maude Stalvey
Purchase Details
Closed on
Aug 15, 1953
Sold by
Lankford J M
Bought by
Yawn Charles
Create a Home Valuation Report for This Property
The Home Valuation Report is an in-depth analysis detailing your home's value as well as a comparison with similar homes in the area
Purchase History
| Date | Buyer | Sale Price | Title Company |
|---|---|---|---|
| Cnp Renovations Llc | $117,900 | -- | |
| Peavy Properties Cordele Llc | -- | -- | |
| Peavy John L | $35,000 | -- | |
| Gurley Mary Kate Yawn | -- | -- | |
| Gurley Mary Kate Yawn | -- | -- | |
| Yawn Maude Stalvey | -- | -- | |
| Yawn Charles | -- | -- |
Source: Public Records
Mortgage History
| Date | Status | Borrower | Loan Amount |
|---|---|---|---|
| Open | Cnp Renovations Llc | $159,715 |
Source: Public Records
Tax History
| Year | Tax Paid | Tax Assessment Tax Assessment Total Assessment is a certain percentage of the fair market value that is determined by local assessors to be the total taxable value of land and additions on the property. | Land | Improvement |
|---|---|---|---|---|
| 2025 | $2,101 | $59,558 | $2,660 | $56,898 |
| 2024 | $1,942 | $54,191 | $2,660 | $51,531 |
| 2023 | $2,010 | $53,610 | $2,660 | $50,950 |
| 2022 | $1,342 | $50,782 | $2,660 | $48,122 |
| 2021 | $1,315 | $47,953 | $2,660 | $45,293 |
| 2020 | $1,350 | $47,953 | $2,660 | $45,293 |
| 2019 | $1,360 | $47,953 | $2,660 | $45,293 |
| 2018 | $1,047 | $35,531 | $2,660 | $32,871 |
| 2017 | $1,443 | $35,531 | $2,660 | $32,871 |
| 2016 | $1,051 | $35,531 | $2,660 | $32,871 |
| 2015 | -- | $27,590 | $1,774 | $25,816 |
| 2014 | -- | $27,590 | $1,774 | $25,816 |
| 2013 | -- | $27,590 | $1,773 | $25,816 |
Source: Public Records
Map
Nearby Homes
Your Personal Tour Guide
Ask me questions while you tour the home.