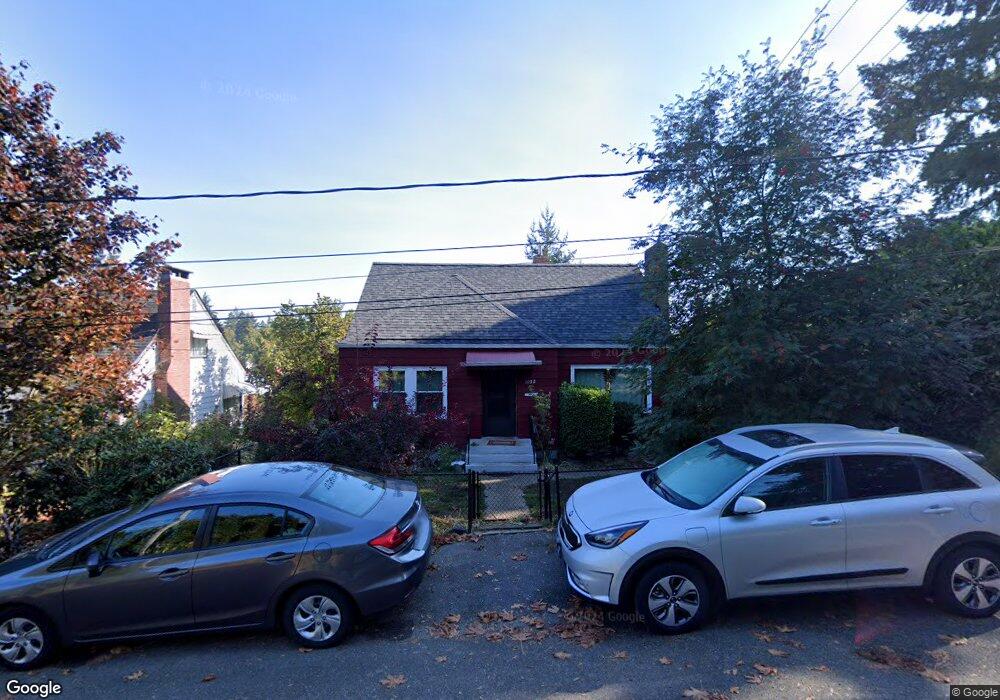
1102 N Lafayette Ave Bremerton, WA 98312
Estimated Value: $461,000 - $498,000
3
Beds
2
Baths
1,529
Sq Ft
$314/Sq Ft
Est. Value
About This Home
This home is located at 1102 N Lafayette Ave, Bremerton, WA 98312 and is currently estimated at $480,813, approximately $314 per square foot. 1102 N Lafayette Ave is a home located in Kitsap County with nearby schools including Crownhill Elementary School, Mountain View Middle School, and Bremerton High School.
Ownership History
Date
Name
Owned For
Owner Type
Purchase Details
Closed on
Sep 12, 2006
Sold by
Daugnault Richard M and Daignault Richard Marc
Bought by
Birdsell Charles and George Diana L
Current Estimated Value
Home Financials for this Owner
Home Financials are based on the most recent Mortgage that was taken out on this home.
Original Mortgage
$47,300
Interest Rate
6.51%
Mortgage Type
Credit Line Revolving
Purchase Details
Closed on
Jul 16, 1998
Sold by
Daignault Monte K
Bought by
Daignault Richard Marc
Purchase Details
Closed on
Jun 18, 1997
Sold by
Reinert John A and Reinert Clara M
Bought by
Daignault Richard M and Daignault Monte K
Home Financials for this Owner
Home Financials are based on the most recent Mortgage that was taken out on this home.
Original Mortgage
$96,900
Interest Rate
7.91%
Mortgage Type
VA
Create a Home Valuation Report for This Property
The Home Valuation Report is an in-depth analysis detailing your home's value as well as a comparison with similar homes in the area
Home Values in the Area
Average Home Value in this Area
Purchase History
| Date | Buyer | Sale Price | Title Company |
|---|---|---|---|
| Birdsell Charles | $236,780 | Transnation Title | |
| Daignault Richard Marc | -- | -- | |
| Daignault Richard M | $95,000 | Transnation Title Insurance |
Source: Public Records
Mortgage History
| Date | Status | Borrower | Loan Amount |
|---|---|---|---|
| Closed | Birdsell Charles | $47,300 | |
| Open | Birdsell Charles | $189,200 | |
| Previous Owner | Daignault Richard M | $96,900 |
Source: Public Records
Tax History Compared to Growth
Tax History
| Year | Tax Paid | Tax Assessment Tax Assessment Total Assessment is a certain percentage of the fair market value that is determined by local assessors to be the total taxable value of land and additions on the property. | Land | Improvement |
|---|---|---|---|---|
| 2026 | $4,038 | $457,710 | $79,150 | $378,560 |
| 2025 | $4,038 | $457,710 | $79,150 | $378,560 |
| 2024 | $3,896 | $457,710 | $79,150 | $378,560 |
| 2023 | $4,027 | $457,710 | $79,150 | $378,560 |
| 2022 | $3,742 | $382,340 | $65,960 | $316,380 |
| 2021 | $3,631 | $339,570 | $49,800 | $289,770 |
| 2020 | $3,376 | $315,490 | $46,090 | $269,400 |
| 2019 | $2,916 | $282,350 | $41,140 | $241,210 |
| 2018 | $2,980 | $188,920 | $30,930 | $157,990 |
| 2017 | $2,473 | $188,920 | $30,930 | $157,990 |
| 2016 | $2,316 | $167,420 | $27,130 | $140,290 |
| 2015 | $2,320 | $166,850 | $29,510 | $137,340 |
| 2014 | -- | $158,770 | $29,510 | $129,260 |
| 2013 | -- | $169,840 | $31,150 | $138,690 |
Source: Public Records
Map
Nearby Homes
- 1309 Times Ave
- 1303 Times Ave
- 1146 N Callow Ave
- 603 N Summit Ave
- 1135 Morgan Rd NW Unit A & B
- 320 N Lafayette Ave
- 2311 8th St
- 3201 17th St
- 1551 N Callow Ave
- 1720 N Wycoff Ave
- 10xx Naval Ave
- 10 XX Naval Ave
- 2013 11th St
- 138 N Rainier Ave
- 107 N Callow Ave
- 2135 4th St
- 931 Oyster Bay Ct
- 114 S Lafayette Ave
- 2613 Burwell St
- 1325 Marguerite Ave
- 1106 N Lafayette Ave
- 1129 N Lafayette Ave
- 1108 N Lafayette Ave
- 946 N Lafayette Ave
- 1101 N Cambrian Ave
- 1103 N Lafayette Ave
- 1112 N Lafayette Ave
- 1113 N Cambrian Ave
- 944 N Lafayette Ave
- 1111 Cambrian Ave
- 1116 N Lafayette Ave
- 1105 N Lafayette Ave
- 1117 N Cambrian Ave
- 1102 N Cambrian Ave
- 1122 N Lafayette Ave
- 3102 11th St
- 1125 N Lafayette Ave
- 1104 N Cambrian Ave
- 1121 N Cambrian Ave
- 1108 N Cambrian Ave