1102 S 8th St Chickasha, OK 73018
Estimated Value: $228,631 - $321,000
4
Beds
3
Baths
2,472
Sq Ft
$109/Sq Ft
Est. Value
About This Home
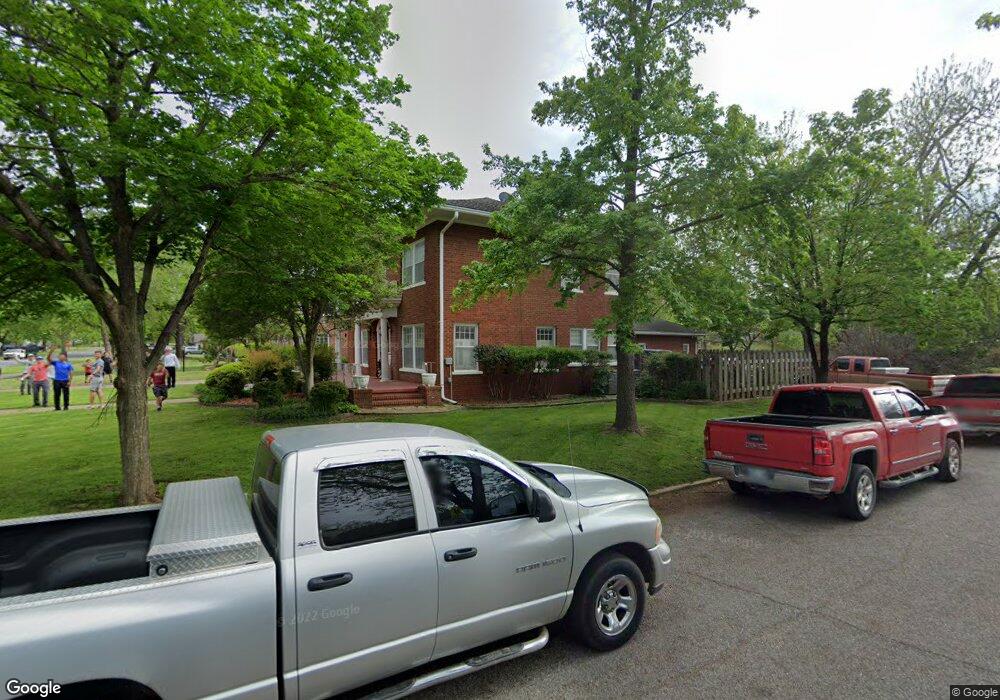
This home is located at 1102 S 8th St, Chickasha, OK 73018 and is currently estimated at $270,658, approximately $109 per square foot. 1102 S 8th St is a home located in Grady County with nearby schools including Grand Avenue Elementary School, Chickasha Middle School, and Lincoln Elementary School.
Ownership History
Date
Name
Owned For
Owner Type
Purchase Details
Closed on
Feb 16, 2018
Sold by
Griffin Matthew
Bought by
Tointigh John and Tointigh Keli
Current Estimated Value
Home Financials for this Owner
Home Financials are based on the most recent Mortgage that was taken out on this home.
Original Mortgage
$210,000
Outstanding Balance
$179,685
Interest Rate
4.5%
Mortgage Type
New Conventional
Estimated Equity
$90,973
Purchase Details
Closed on
Jul 2, 2014
Sold by
Posey Ryan B and Posey Ashley N
Bought by
Griffin Matthew
Purchase Details
Closed on
Sep 30, 2009
Sold by
Jones Angela Caywood and Jones John David
Bought by
Posey Ryan B and Posey Ashley N
Home Financials for this Owner
Home Financials are based on the most recent Mortgage that was taken out on this home.
Original Mortgage
$188,500
Interest Rate
5.1%
Mortgage Type
Unknown
Create a Home Valuation Report for This Property
The Home Valuation Report is an in-depth analysis detailing your home's value as well as a comparison with similar homes in the area
Home Values in the Area
Average Home Value in this Area
Purchase History
| Date | Buyer | Sale Price | Title Company |
|---|---|---|---|
| Tointigh John | $210,000 | None Available | |
| Griffin Matthew | $215,000 | -- | |
| Posey Ryan B | $189,000 | None Available |
Source: Public Records
Mortgage History
| Date | Status | Borrower | Loan Amount |
|---|---|---|---|
| Open | Tointigh John | $210,000 | |
| Previous Owner | Posey Ryan B | $188,500 |
Source: Public Records
Tax History
| Year | Tax Paid | Tax Assessment Tax Assessment Total Assessment is a certain percentage of the fair market value that is determined by local assessors to be the total taxable value of land and additions on the property. | Land | Improvement |
|---|---|---|---|---|
| 2025 | $2,520 | $24,700 | $1,856 | $22,844 |
| 2024 | $2,385 | $23,524 | $1,767 | $21,757 |
| 2023 | $2,385 | $22,404 | $2,055 | $20,349 |
| 2022 | $2,328 | $22,386 | $1,715 | $20,671 |
| 2021 | $2,274 | $22,627 | $1,715 | $20,912 |
| 2020 | $2,359 | $22,905 | $1,715 | $21,190 |
| 2019 | $2,378 | $23,535 | $1,715 | $21,820 |
| 2018 | $2,385 | $24,171 | $885 | $23,286 |
| 2017 | $2,385 | $24,040 | $885 | $23,155 |
| 2016 | $2,365 | $23,650 | $885 | $22,765 |
| 2015 | $2,099 | $23,650 | $885 | $22,765 |
| 2014 | $2,099 | $21,040 | $885 | $20,155 |
Source: Public Records
Map
Nearby Homes