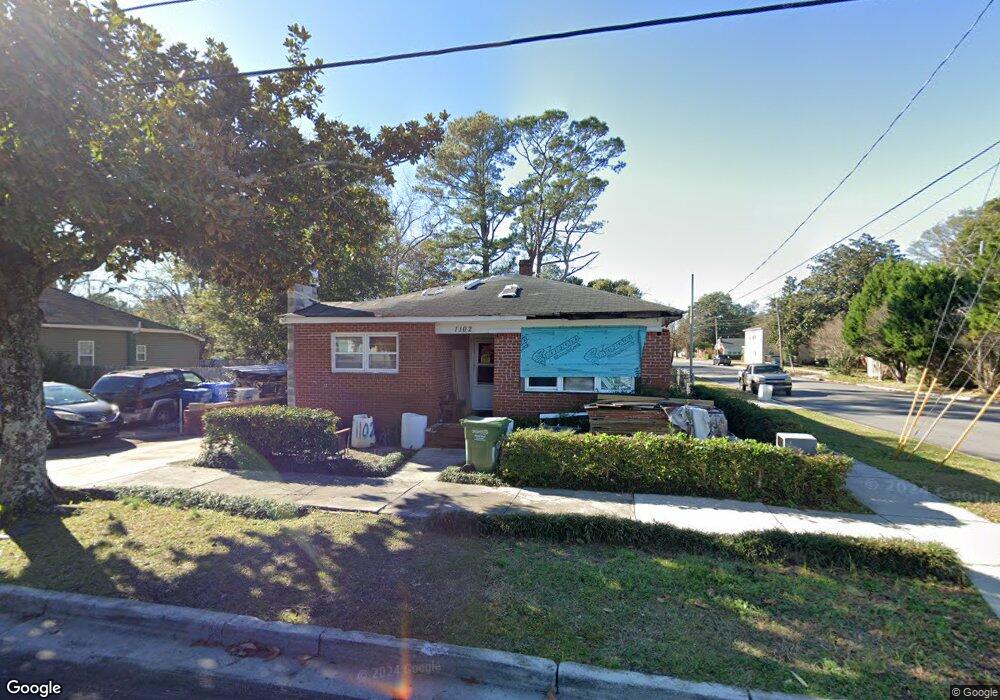
1102 S 8th St Wilmington, NC 28401
Dry Pond-South Side NeighborhoodEstimated Value: $191,000 - $220,000
3
Beds
1
Bath
1,344
Sq Ft
$153/Sq Ft
Est. Value
About This Home
This home is located at 1102 S 8th St, Wilmington, NC 28401 and is currently estimated at $205,489, approximately $152 per square foot. 1102 S 8th St is a home located in New Hanover County with nearby schools including Forest Hills Global Elementary School, Myrtle Grove Middle School, and John T. Hoggard High School.
Ownership History
Date
Name
Owned For
Owner Type
Purchase Details
Closed on
Jul 19, 2024
Sold by
Bryant Franklin Numan
Bought by
Vinny Inc
Current Estimated Value
Purchase Details
Closed on
Mar 25, 2019
Sold by
Bryant Franklin Numan and Bryant Phyllis C
Bought by
Bryant Franklin Numan
Purchase Details
Closed on
Jun 1, 1979
Bought by
Bryant Franklin N Phyllis C
Create a Home Valuation Report for This Property
The Home Valuation Report is an in-depth analysis detailing your home's value as well as a comparison with similar homes in the area
Home Values in the Area
Average Home Value in this Area
Purchase History
| Date | Buyer | Sale Price | Title Company |
|---|---|---|---|
| Vinny Inc | $147,000 | None Listed On Document | |
| Bryant Franklin Numan | -- | None Available | |
| Bryant Franklin N Phyllis C | -- | -- |
Source: Public Records
Tax History Compared to Growth
Tax History
| Year | Tax Paid | Tax Assessment Tax Assessment Total Assessment is a certain percentage of the fair market value that is determined by local assessors to be the total taxable value of land and additions on the property. | Land | Improvement |
|---|---|---|---|---|
| 2025 | $657 | $142,500 | $64,900 | $77,600 |
| 2023 | $657 | $151,200 | $49,000 | $102,200 |
| 2022 | $482 | $151,200 | $49,000 | $102,200 |
| 2021 | $447 | $151,200 | $49,000 | $102,200 |
| 2020 | $557 | $105,700 | $46,000 | $59,700 |
| 2019 | $557 | $105,700 | $46,000 | $59,700 |
| 2018 | $557 | $105,700 | $46,000 | $59,700 |
| 2017 | $557 | $105,700 | $46,000 | $59,700 |
| 2016 | $981 | $177,000 | $81,300 | $95,700 |
| 2015 | $937 | $177,000 | $81,300 | $95,700 |
| 2014 | $897 | $177,000 | $81,300 | $95,700 |
Source: Public Records
Map
Nearby Homes