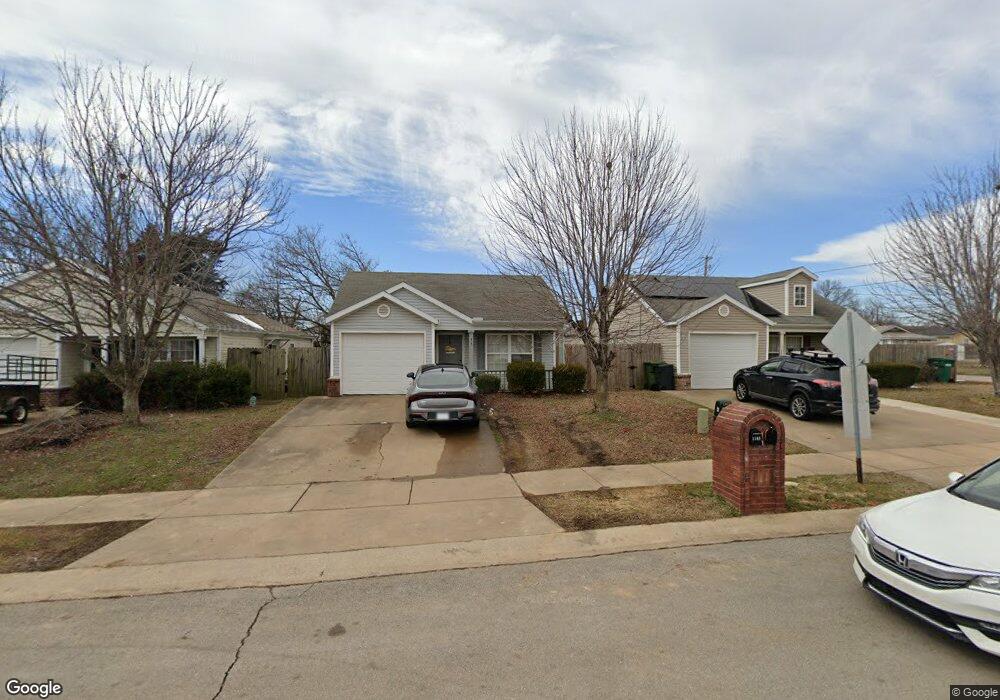
1102 S C Ct Rogers, AR 72756
Estimated Value: $234,000 - $243,000
3
Beds
2
Baths
1,032
Sq Ft
$230/Sq Ft
Est. Value
About This Home
This home is located at 1102 S C Ct, Rogers, AR 72756 and is currently estimated at $237,555, approximately $230 per square foot. 1102 S C Ct is a home located in Benton County with nearby schools including Frank Tillery Elementary School, Lingle Middle School, and Rogers Heritage High School.
Ownership History
Date
Name
Owned For
Owner Type
Purchase Details
Closed on
Aug 21, 2009
Sold by
Federal National Mortgage Association
Bought by
Perez Mayra Garcia
Current Estimated Value
Home Financials for this Owner
Home Financials are based on the most recent Mortgage that was taken out on this home.
Original Mortgage
$74,720
Outstanding Balance
$48,494
Interest Rate
5.2%
Mortgage Type
FHA
Estimated Equity
$189,061
Purchase Details
Closed on
Apr 20, 2009
Sold by
Pineda Santos and Pineda Santos A
Bought by
Federal National Mortgage Association
Purchase Details
Closed on
Jan 4, 2008
Sold by
Burckart Construction Inc
Bought by
Pineda Santos A
Home Financials for this Owner
Home Financials are based on the most recent Mortgage that was taken out on this home.
Original Mortgage
$113,500
Interest Rate
5.94%
Mortgage Type
Purchase Money Mortgage
Create a Home Valuation Report for This Property
The Home Valuation Report is an in-depth analysis detailing your home's value as well as a comparison with similar homes in the area
Home Values in the Area
Average Home Value in this Area
Purchase History
| Date | Buyer | Sale Price | Title Company |
|---|---|---|---|
| Perez Mayra Garcia | $25,000 | None Available | |
| Perez Mayra Garcia | $25,000 | None Available | |
| Federal National Mortgage Association | $95,795 | None Available | |
| Federal National Mortgage Association | $95,795 | None Available | |
| Pineda Santos A | $114,000 | First National Title Company | |
| Pineda Santos A | $114,000 | First National Title Company |
Source: Public Records
Mortgage History
| Date | Status | Borrower | Loan Amount |
|---|---|---|---|
| Open | Perez Mayra Garcia | $74,720 | |
| Previous Owner | Pineda Santos A | $113,500 |
Source: Public Records
Tax History
| Year | Tax Paid | Tax Assessment Tax Assessment Total Assessment is a certain percentage of the fair market value that is determined by local assessors to be the total taxable value of land and additions on the property. | Land | Improvement |
|---|---|---|---|---|
| 2025 | $1,183 | $45,051 | $19,000 | $26,051 |
| 2024 | $1,101 | $45,051 | $19,000 | $26,051 |
| 2023 | $1,049 | $27,580 | $8,000 | $19,580 |
| 2022 | $668 | $27,580 | $8,000 | $19,580 |
| 2021 | $619 | $27,580 | $8,000 | $19,580 |
| 2020 | $572 | $17,880 | $2,400 | $15,480 |
| 2019 | $534 | $17,880 | $2,400 | $15,480 |
| 2018 | $521 | $17,880 | $2,400 | $15,480 |
| 2017 | $402 | $17,880 | $2,400 | $15,480 |
| 2016 | $402 | $17,880 | $2,400 | $15,480 |
| 2015 | $730 | $13,800 | $2,850 | $10,950 |
| 2014 | $380 | $13,800 | $2,850 | $10,950 |
Source: Public Records
Map
Nearby Homes
Your Personal Tour Guide
Ask me questions while you tour the home.