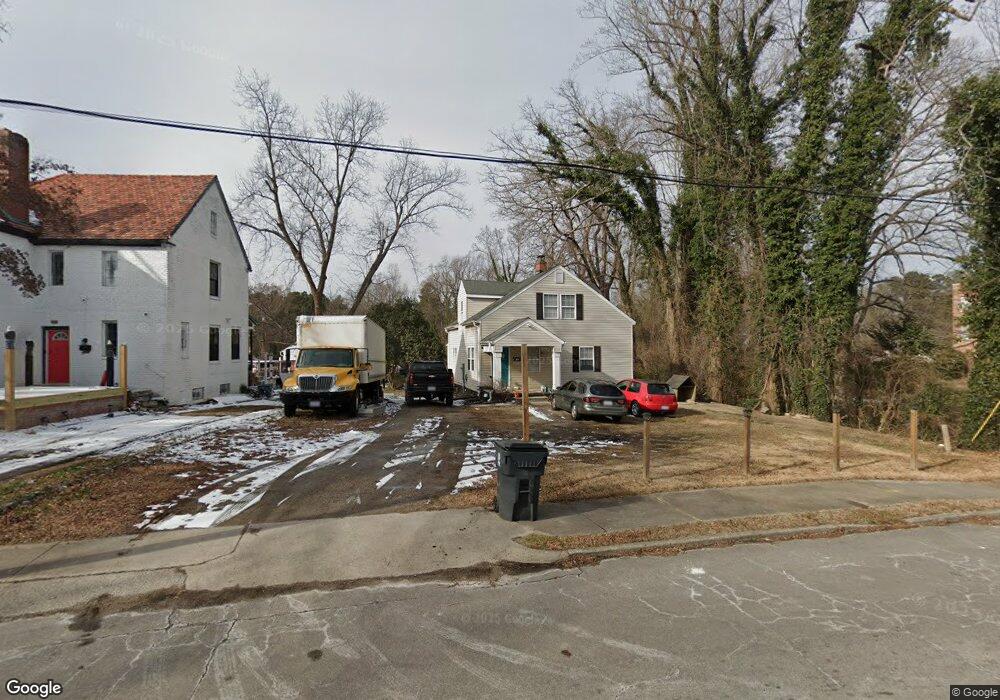
1102 S Chestnut St Henderson, NC 27536
Estimated Value: $187,596 - $278,000
4
Beds
2
Baths
1,650
Sq Ft
$133/Sq Ft
Est. Value
About This Home
This home is located at 1102 S Chestnut St, Henderson, NC 27536 and is currently estimated at $219,899, approximately $133 per square foot. 1102 S Chestnut St is a home located in Vance County with nearby schools including E.M. Rollins Elementary School, Vance County High School, and Henderson Collegiate Public Charter School.
Ownership History
Date
Name
Owned For
Owner Type
Purchase Details
Closed on
Mar 20, 2021
Sold by
Franklin John Michael and Franklin Rose Marie
Bought by
Garcia Christian Javier Quintana
Current Estimated Value
Home Financials for this Owner
Home Financials are based on the most recent Mortgage that was taken out on this home.
Original Mortgage
$152,000
Outstanding Balance
$138,556
Interest Rate
3.75%
Mortgage Type
New Conventional
Estimated Equity
$81,343
Purchase Details
Closed on
Sep 29, 2008
Sold by
Walker Laurie Williamson and Walker David L
Bought by
Franklin John Michael
Purchase Details
Closed on
Mar 26, 2008
Sold by
Uzmann John David
Bought by
Uzmann Laurie Williamson and Williamson Henry T
Purchase Details
Closed on
Oct 17, 2006
Sold by
Evans Ulysses and Evans Mattie M
Bought by
Uzmann Courtney H
Home Financials for this Owner
Home Financials are based on the most recent Mortgage that was taken out on this home.
Original Mortgage
$8,000
Interest Rate
6.31%
Mortgage Type
Future Advance Clause Open End Mortgage
Create a Home Valuation Report for This Property
The Home Valuation Report is an in-depth analysis detailing your home's value as well as a comparison with similar homes in the area
Purchase History
| Date | Buyer | Sale Price | Title Company |
|---|---|---|---|
| Garcia Christian Javier Quintana | $150,000 | None Available | |
| Franklin John Michael | $22,000 | -- | |
| Uzmann Laurie Williamson | -- | -- | |
| Uzmann Courtney H | $10,000 | -- |
Source: Public Records
Mortgage History
| Date | Status | Borrower | Loan Amount |
|---|---|---|---|
| Open | Garcia Christian Javier Quintana | $152,000 | |
| Previous Owner | Uzmann Courtney H | $8,000 |
Source: Public Records
Tax History
| Year | Tax Paid | Tax Assessment Tax Assessment Total Assessment is a certain percentage of the fair market value that is determined by local assessors to be the total taxable value of land and additions on the property. | Land | Improvement |
|---|---|---|---|---|
| 2025 | $2,114 | $144,372 | $6,000 | $138,372 |
| 2024 | $2,093 | $144,372 | $6,000 | $138,372 |
| 2023 | $1,202 | $65,993 | $7,416 | $58,577 |
| 2022 | $1,177 | $65,993 | $7,416 | $58,577 |
| 2021 | $1,057 | $65,993 | $7,416 | $58,577 |
| 2020 | $1,174 | $65,993 | $7,416 | $58,577 |
| 2019 | $1,169 | $65,993 | $7,416 | $58,577 |
| 2018 | $1,057 | $65,993 | $7,416 | $58,577 |
| 2017 | $1,162 | $65,993 | $7,416 | $58,577 |
| 2016 | $1,162 | $65,993 | $7,416 | $58,577 |
| 2015 | $946 | $53,420 | $14,832 | $38,588 |
| 2014 | $860 | $53,474 | $14,832 | $38,642 |
Source: Public Records
Map
Nearby Homes
- 210 Zollicoffer Ave
- 145 Granite St
- 934 S Chestnut St
- 925 S Chestnut St
- 125 E Jennette Ave
- 830 S Chestnut St
- 1115 Park Ave
- 01 U S 158 Business
- 910 Marrow Dr
- 818 Dorsey Ave
- 169 Burwell Ave
- 1125 Beacon Ave
- 910 Parham St
- 232 Burwell Ave Unit 1,2,3
- 00 Young Ave
- 521 Spring Ct
- 403 Spring Ct
- 419 Oak St
- 410 Spring Ct
- 402 Spring Ct
- 1104 S Chestnut St
- 210 Perry St
- 1103 S Chestnut St
- 1029 S Chestnut St
- 207 Perry St
- 1023 S Chestnut St
- 209 Perry St
- 211 Perry St
- 119 W Jennette Ave
- 1203 S Chestnut St
- 1205 S Chestnut St
- 116 W Jennette Ave
- 1017 S Chestnut St
- 213 Perry St
- 216 Perry St
- 215 Perry St
- 115 W Jennette Ave
- 206 Zollicoffer Ave
- 115 Perry St
- 208 Zollicoffer Ave
Your Personal Tour Guide
Ask me questions while you tour the home.