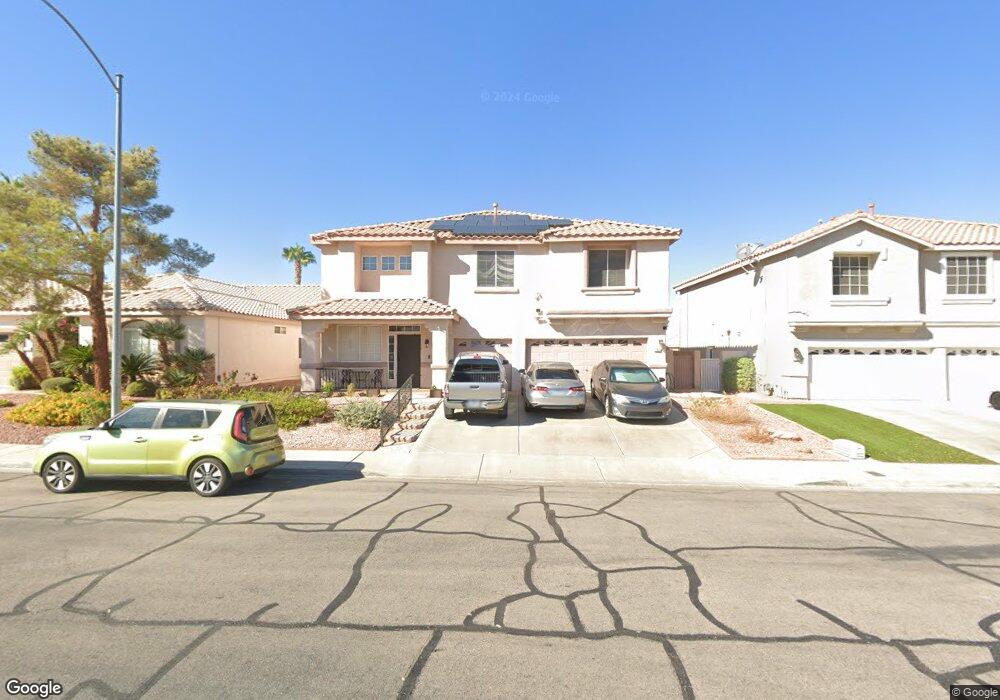
1102 Teal Point Dr Henderson, NV 89074
Gibson Springs NeighborhoodEstimated Value: $650,000 - $693,000
6
Beds
3
Baths
3,159
Sq Ft
$210/Sq Ft
Est. Value
About This Home
This home is located at 1102 Teal Point Dr, Henderson, NV 89074 and is currently estimated at $663,337, approximately $209 per square foot. 1102 Teal Point Dr is a home located in Clark County with nearby schools including Lorna J Kesterson Elementary School, Barbara and Hank Greenspun Junior High School, and Green Valley High School.
Ownership History
Date
Name
Owned For
Owner Type
Purchase Details
Closed on
Sep 4, 2003
Sold by
Mayfield Daryl and Mayfield Gloria A
Bought by
Mayfield Daryl and Mayfield Gloria A
Current Estimated Value
Home Financials for this Owner
Home Financials are based on the most recent Mortgage that was taken out on this home.
Original Mortgage
$256,000
Outstanding Balance
$119,003
Interest Rate
6.27%
Mortgage Type
Unknown
Estimated Equity
$544,334
Purchase Details
Closed on
Oct 11, 2001
Sold by
Mayfield Daryl and Mayfield Gloria A
Bought by
Mayfield Daryl and Mayfield Gloria A
Purchase Details
Closed on
Nov 19, 1997
Sold by
Gibson Ranch Ltd Liability Company
Bought by
Mayfield Daryl and Mayfield Gloria A
Home Financials for this Owner
Home Financials are based on the most recent Mortgage that was taken out on this home.
Original Mortgage
$173,300
Interest Rate
7.23%
Create a Home Valuation Report for This Property
The Home Valuation Report is an in-depth analysis detailing your home's value as well as a comparison with similar homes in the area
Home Values in the Area
Average Home Value in this Area
Purchase History
| Date | Buyer | Sale Price | Title Company |
|---|---|---|---|
| Mayfield Daryl | -- | Land Title Of Nevada | |
| Mayfield Daryl | -- | Land Title Of Nevada | |
| Mayfield Daryl | -- | -- | |
| Mayfield Daryl | $183,000 | National Title Company |
Source: Public Records
Mortgage History
| Date | Status | Borrower | Loan Amount |
|---|---|---|---|
| Open | Mayfield Daryl | $256,000 | |
| Closed | Mayfield Daryl | $173,300 | |
| Closed | Mayfield Daryl | $32,000 |
Source: Public Records
Tax History Compared to Growth
Tax History
| Year | Tax Paid | Tax Assessment Tax Assessment Total Assessment is a certain percentage of the fair market value that is determined by local assessors to be the total taxable value of land and additions on the property. | Land | Improvement |
|---|---|---|---|---|
| 2025 | $3,202 | $156,613 | $41,300 | $115,313 |
| 2024 | $3,140 | $156,613 | $41,300 | $115,313 |
| 2023 | $3,140 | $147,641 | $37,975 | $109,666 |
| 2022 | $3,087 | $129,774 | $29,400 | $100,374 |
| 2021 | $2,997 | $124,382 | $28,700 | $95,682 |
| 2020 | $2,907 | $122,913 | $28,000 | $94,913 |
| 2019 | $2,872 | $118,570 | $24,850 | $93,720 |
| 2018 | $2,740 | $111,015 | $21,000 | $90,015 |
| 2017 | $3,212 | $110,793 | $19,250 | $91,543 |
| 2016 | $2,565 | $105,577 | $14,350 | $91,227 |
| 2015 | $2,560 | $101,096 | $11,550 | $89,546 |
| 2014 | $2,485 | $84,628 | $9,100 | $75,528 |
Source: Public Records
Map
Nearby Homes
- 268 Copper Glow Ct
- 1078 Broomfield Dr
- 1323 Winter Solstice Ave
- 225 Prairie Sky Ct
- 1107 Cloudy Day Dr
- 1211 Evening Canyon Ave
- 233 Leaf Bud Ct
- 227 November Sky St
- 202 Twin Creek St
- 1048 Painted Daisy Ave
- 276 Full Wine St
- 1146 Light Sky Ave
- 1194 Simms Ave Unit 3103
- 209 Winterport St
- 1025 Tabor Hill Ave
- 1410 Red Sunset Ave
- 314 Carole Little Ct
- 220 Winnsboro St
- 331 Mount Hope St
- 328 Mount Hope St
- 1100 Teal Point Dr
- 1104 Teal Point Dr
- 261 Copper Glow Ct
- 1098 Teal Point Dr
- 255 Flirtation Ct
- 256 Autumn Eve St
- 262 Copper Glow Ct
- 258 Autumn Eve St
- 263 Copper Glow Ct
- 1096 Teal Point Dr
- 256 Flirtation Ct
- 260 Autumn Eve St
- 264 Copper Glow Ct
- 253 Flirtation Ct
- 254 Autumn Eve St Unit 2
- 262 Autumn Eve St
- 262 Autumn Eve St
- 262 Autumn Eve St Unit 1
- 265 Copper Glow Ct
- 254 Flirtation Ct