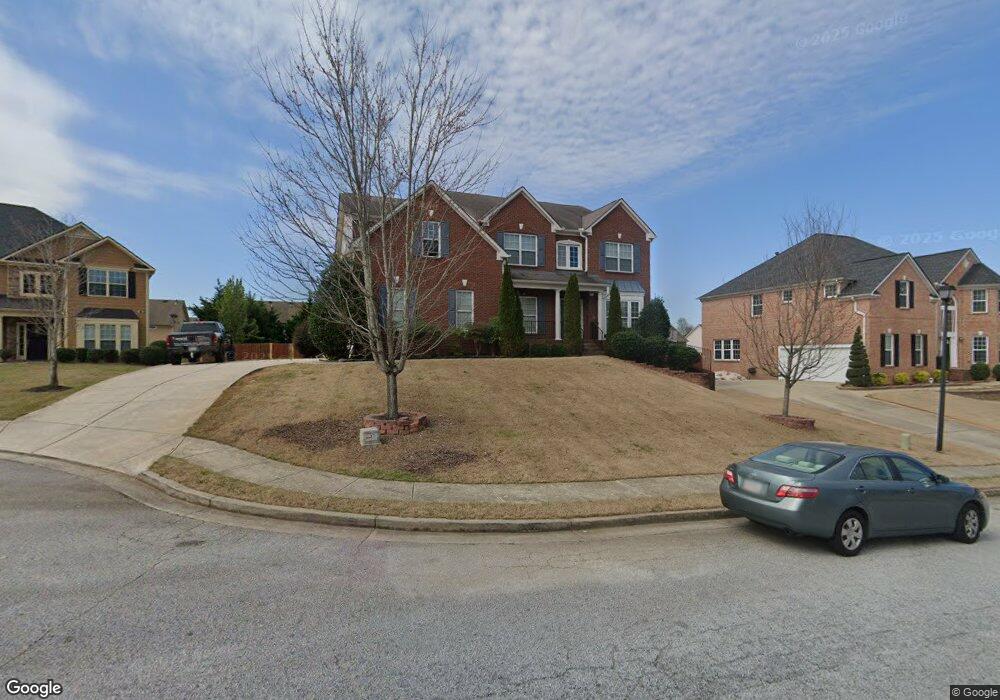
1102 Tupelo Chase Ct Auburn, GA 30011
Estimated Value: $500,000 - $748,000
5
Beds
4
Baths
5,326
Sq Ft
$114/Sq Ft
Est. Value
About This Home
This home is located at 1102 Tupelo Chase Ct, Auburn, GA 30011 and is currently estimated at $604,687, approximately $113 per square foot. 1102 Tupelo Chase Ct is a home located in Gwinnett County with nearby schools including Mulberry Elementary School, Dacula Middle School, and Dacula High School.
Ownership History
Date
Name
Owned For
Owner Type
Purchase Details
Closed on
Mar 8, 2010
Sold by
Federal Natl Mtg Assn Fnma
Bought by
Jackson Veronica
Current Estimated Value
Home Financials for this Owner
Home Financials are based on the most recent Mortgage that was taken out on this home.
Original Mortgage
$170,910
Outstanding Balance
$112,326
Interest Rate
4.97%
Mortgage Type
New Conventional
Estimated Equity
$492,361
Purchase Details
Closed on
Feb 3, 2009
Sold by
Countrywide Hm Lns Svcg
Bought by
Federal Natl Mtg Assn Fnma
Purchase Details
Closed on
Sep 26, 2006
Sold by
Ryland Group Inc
Bought by
Senatus Francois and Senatus Michaelle
Home Financials for this Owner
Home Financials are based on the most recent Mortgage that was taken out on this home.
Original Mortgage
$329,674
Interest Rate
6.46%
Mortgage Type
New Conventional
Create a Home Valuation Report for This Property
The Home Valuation Report is an in-depth analysis detailing your home's value as well as a comparison with similar homes in the area
Home Values in the Area
Average Home Value in this Area
Purchase History
| Date | Buyer | Sale Price | Title Company |
|---|---|---|---|
| Jackson Veronica | $189,900 | -- | |
| Federal Natl Mtg Assn Fnma | -- | -- | |
| Countrywide Hm Lns Svcg | $382,684 | -- | |
| Senatus Francois | $366,400 | -- |
Source: Public Records
Mortgage History
| Date | Status | Borrower | Loan Amount |
|---|---|---|---|
| Open | Jackson Veronica | $170,910 | |
| Previous Owner | Senatus Francois | $329,674 |
Source: Public Records
Tax History Compared to Growth
Tax History
| Year | Tax Paid | Tax Assessment Tax Assessment Total Assessment is a certain percentage of the fair market value that is determined by local assessors to be the total taxable value of land and additions on the property. | Land | Improvement |
|---|---|---|---|---|
| 2025 | $3,615 | $295,200 | $30,000 | $265,200 |
| 2024 | $3,764 | $257,000 | $32,800 | $224,200 |
| 2023 | $3,764 | $254,040 | $32,800 | $221,240 |
| 2022 | $8,146 | $218,920 | $28,000 | $190,920 |
| 2021 | $6,180 | $160,840 | $22,400 | $138,440 |
| 2020 | $5,794 | $149,160 | $18,400 | $130,760 |
| 2019 | $5,578 | $149,160 | $18,400 | $130,760 |
| 2018 | $5,589 | $149,160 | $18,400 | $130,760 |
| 2016 | $4,391 | $114,560 | $12,800 | $101,760 |
| 2015 | $4,439 | $114,560 | $12,800 | $101,760 |
| 2014 | -- | $114,560 | $12,800 | $101,760 |
Source: Public Records
Map
Nearby Homes
- 1100 Rock Elm Dr Unit 1
- 3613 Walking Stick Way
- 3439 Tupelo Trail
- 3449 Mulberry Cove Way
- 3569 Tupelo Trail
- 3630 Tupelo Trail Unit 1
- 3590 Tupelo Trail
- 947 Tama Hill Ct
- 3536 Bridle Brook Dr
- 811 Rock Elm Dr
- 1267 Clear Stream Ridge
- 3463 Hillyard Dr
- 310 Meacham Ct
- 300 Meacham Ct
- 636 Rodeo Dr
- 619 Catesby Terrace
- 1112 Tupelo Chase Ct Unit 1
- 1092 Tupelo Chase Ct Unit 12
- 1092 Tupelo Chase Ct Unit 1
- 1092 Tupelo Chase Ct
- 1092 Tupelo Chase Ct Unit 1092
- 1051 Rock Elm Dr Unit 1051
- 1051 Rock Elm Dr
- 1061 Rock Elm Dr Unit 1
- 1041 Rock Elm Dr
- 1071 Rock Elm Dr Unit 13D
- 1071 Rock Elm Dr Unit 13
- 1071 Rock Elm Dr
- 1122 Tupelo Chase Ct
- 1082 Tupelo Chase Ct Unit 1
- 1031 Rock Elm Dr Unit 1031
- 1031 Rock Elm Dr
- 1103 Tupelo Chase Ct Unit 1
- 1081 Rock Elm Dr
- 1113 Tupelo Chase Ct
- 1132 Tupelo Chase Ct Unit 1