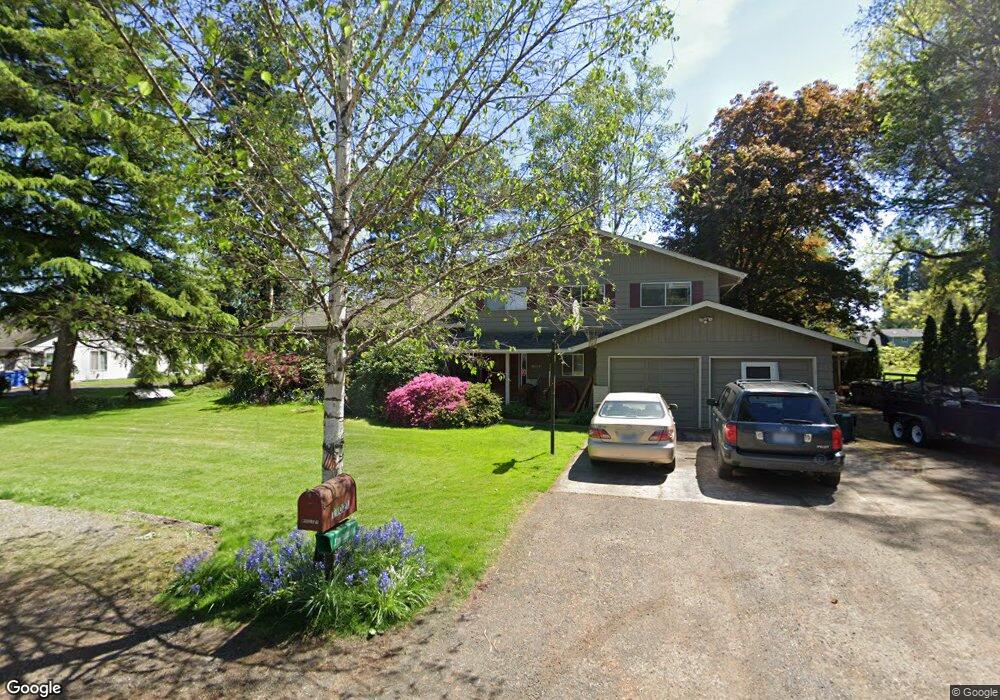
11021 NE 183rd St Battle Ground, WA 98604
Estimated Value: $689,144 - $711,000
4
Beds
3
Baths
2,462
Sq Ft
$284/Sq Ft
Est. Value
About This Home
This home is located at 11021 NE 183rd St, Battle Ground, WA 98604 and is currently estimated at $699,786, approximately $284 per square foot. 11021 NE 183rd St is a home located in Clark County with nearby schools including Maple Grove Primary School, Prairie High School, and Firm Foundation Christian School.
Ownership History
Date
Name
Owned For
Owner Type
Purchase Details
Closed on
Jul 2, 2007
Sold by
Jorgenson Janet Lynn
Bought by
Woolsey Dwayne L and Woolsey Denise S
Current Estimated Value
Home Financials for this Owner
Home Financials are based on the most recent Mortgage that was taken out on this home.
Original Mortgage
$208,500
Outstanding Balance
$129,363
Interest Rate
6.36%
Mortgage Type
Purchase Money Mortgage
Estimated Equity
$570,423
Purchase Details
Closed on
Feb 25, 2005
Sold by
Jorgenson Dennis
Bought by
Jorgenson Jan
Purchase Details
Closed on
Jul 27, 2001
Sold by
Lewis Charles R and Lewis Jo Ellen
Bought by
Jorgenson Dennis Alan and Jorgenson Janet Lynn
Home Financials for this Owner
Home Financials are based on the most recent Mortgage that was taken out on this home.
Original Mortgage
$242,250
Interest Rate
7.19%
Create a Home Valuation Report for This Property
The Home Valuation Report is an in-depth analysis detailing your home's value as well as a comparison with similar homes in the area
Home Values in the Area
Average Home Value in this Area
Purchase History
| Date | Buyer | Sale Price | Title Company |
|---|---|---|---|
| Woolsey Dwayne L | $350,000 | Stewart Title | |
| Jorgenson Jan | -- | -- | |
| Jorgenson Dennis Alan | $255,000 | Fidelity National Title Co |
Source: Public Records
Mortgage History
| Date | Status | Borrower | Loan Amount |
|---|---|---|---|
| Open | Woolsey Dwayne L | $208,500 | |
| Previous Owner | Jorgenson Dennis Alan | $242,250 |
Source: Public Records
Tax History Compared to Growth
Tax History
| Year | Tax Paid | Tax Assessment Tax Assessment Total Assessment is a certain percentage of the fair market value that is determined by local assessors to be the total taxable value of land and additions on the property. | Land | Improvement |
|---|---|---|---|---|
| 2025 | $5,136 | $602,622 | $255,000 | $347,622 |
| 2024 | $4,579 | $587,556 | $255,000 | $332,556 |
| 2023 | $4,984 | $588,209 | $255,000 | $333,209 |
| 2022 | $4,544 | $585,996 | $274,150 | $311,846 |
| 2021 | $4,317 | $496,031 | $224,750 | $271,281 |
| 2020 | $4,290 | $429,811 | $210,500 | $219,311 |
| 2019 | $3,627 | $418,919 | $192,450 | $226,469 |
| 2018 | $4,255 | $405,782 | $0 | $0 |
| 2017 | $3,739 | $363,646 | $0 | $0 |
| 2016 | $3,548 | $347,278 | $0 | $0 |
| 2015 | $3,358 | $303,766 | $0 | $0 |
| 2014 | -- | $273,754 | $0 | $0 |
| 2013 | -- | $257,392 | $0 | $0 |
Source: Public Records
Map
Nearby Homes
- 11201 NE 182nd St
- 18001 NE 110th Ave
- 18004 NE 113th Ave
- 10704 NE 189th St
- 11700 NE 185th St
- 4102 NE 187th St Unit LOT 289
- 1707 SW 25th Cir
- Glenwood Plan at Woodin Creek Station
- Turquoise Plan at Woodin Creek Station
- Laurel Plan at Woodin Creek Station
- Dahlia Plan at Woodin Creek Station - Townhomes
- Nettle Plan at Woodin Creek Station - Townhomes
- Bramble Plan at Woodin Creek Station - Townhomes
- Oakridge Plan at Woodin Creek Station
- Riverbend Plan at Woodin Creek Station
- 12605 NE 184th St
- 10400 NE 197th St
- 409 SW 31st St
- 9307 NE 179th St
- 411 SW 32nd St
- 11103 NE 183rd St
- 18205 NE 110th Ave
- 11008 NE 183rd St
- 11104 NE 183rd St
- 11004 NE 183rd St
- 20102 NE 110th Ave
- 11111 NE 183rd St
- 10902 NE 183rd St
- 11004 NE 181st Cir
- 11104 NE 181st Cir
- 10901 NE 183rd St
- 20550 NE 112th Ave
- 11200 NE 182nd St
- 10818 NE 183rd St
- 18010 NE 110th Ave
- 18402 NE 111th Ave
- 10811 NE 183rd St
- 11001 NE 181st Cir
- 11101 NE 181st Cir
- 18403 NE 111th Ave